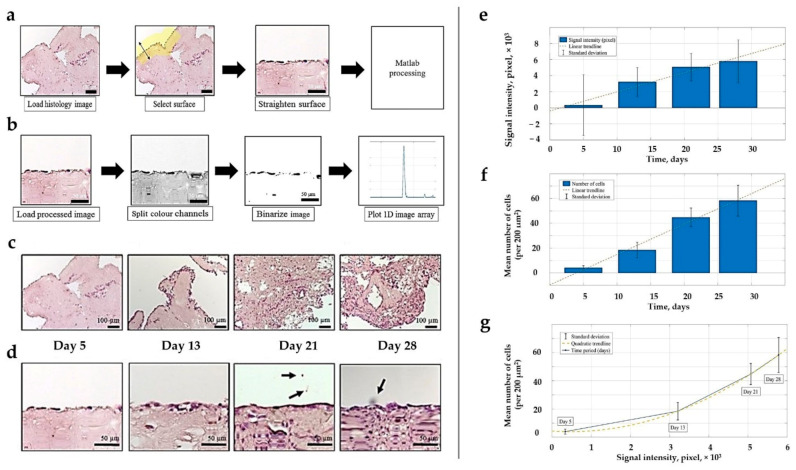
Figure A10.
(a,b) The procedure of the digital image analysis of surface colonization pattern illustrated with a histology image of the CE liver/TNBC TECs at day 5 of the in vitro culture. (a) The first part of the algorithm is implemented in ImageJ and includes loading of image, selection of the surface area of 300 pixels in width, and straightening of the selected surface. The arrow on the yellow shade indicates a width of 300 pixels. (b) The second part of the algorithm is implemented in MATLAB and includes loading of the image processed in ImageJ, splitting of color channels, binarization of the green channel image with the with a threshold of 0.35, and creation of 1D image array, e.g., the image’s signal intensity is plotted versus the matrix depth in micrometers. (c,d) Distribution of the cells near the surface of the TECs over a period of 28 days. (c) Original histology images and (d) corresponding images of the digitally straightened and analyzed surface areas of the TECs. Arrows indicate sample impurities, which may occur during sample preparation. (e–g) Results of the digital image analysis of the TECs’ surfaces colonization patterns. Note the linear growth of cellular density near the TECs surfaces over the observation time. (e) Signal intensity in the surface areas of the TECs over the time (28 days). (f) Average number of cells per 200 µm2 in the surface areas of the TECs over time (28 days). (g) Average number of cells versus signal intensity (pixel) at four different time points (5, 13, 21, and 28 days). Scale bars: (a) left and middle panels 100 µm, and the right panel 50 µm; (b) and (d) all panels 50 µm; (c) all panels 100 µm.

