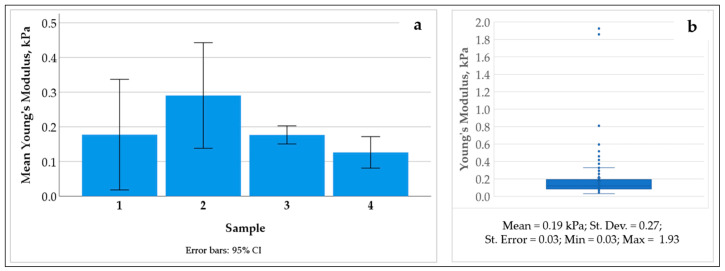
Figure A6.
Mechanical characterization of the LS-ECM in hydrated state. Peak force mapping illustrates the distribution of the mean Young’s modulus across four samples of CE liver AOSSs (a) and overall distribution of the values in the whole set of samples (the dots show the individual values emerged beyond the 25%-75% interquartile range) (b).

