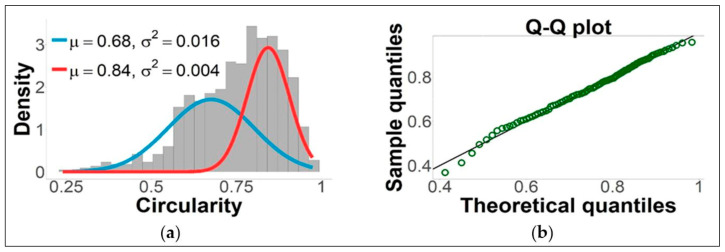
Figure A9.
(a) A histogram of the circularity values of the total number of 706 individual cells examined in TECs collected after 1 week of in vitro culture. The data are best described by two normal distributions (blue and red curves represent probability density functions) and reveal the formation of two subpopulations of cancer cells with different circularities such as elongated oval-shaped “mesenchymal-like” and nearly circular-shaped “epithelioid” cells with circularity values of ~0.68 and ~0.84, respectively. (b) Comparison between the quantiles of the theoretical bimodal normal distribution with the quantiles of the observed data. The data points are positioned close to y = x, indicating that the distribution of the sample data is similar to the normal distribution.

