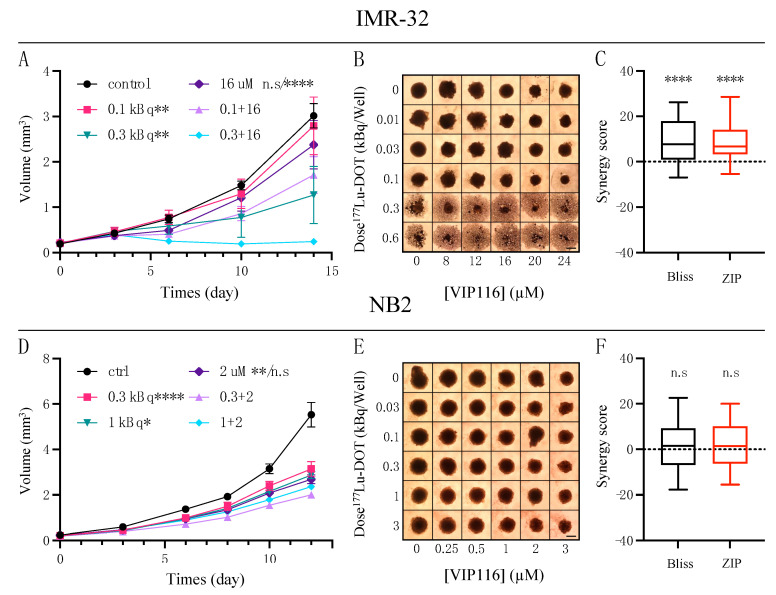
Figure 3.
Spheroid combination therapy. (A) Representative graph (mean ± SD, n ≥ 4) of IM R-32 spheroids treated with 0.1 or 0.3 kBq 177Lu-DOTATATE and 16 μM VIP116. p-value indications next to monotherapy legends are in comparison to the corresponding combination group(s). (B) Representative IM R-32 spheroid images at day 14. Scale bar = 500 μm. (C) Synergy values for IM R-32 spheroid combinations using Bliss (black) or ZIP (red) synergy models. Values below 0 indicate antagonism, 0 indicates additive effect and above 0 indicates synergy. Pooled data from two independent experiments (n = 50) are presented as mean with box (25th to 75th percentile) and whiskers (min to max). (D) Representative graph (mean ± SD, n ≥ 4) of NB2 spheroids treated with 0.3 or 1 kBq 177Lu-DOTATATE and 2 μM VIP116. p-value indications next to monotherapy legends are in comparison to the corresponding combination group(s). (E) Representative NB2 spheroid images at day 12. Scale bar = 500 μm. (F) Synergy values for NB2 spheroid combinations using Bliss (black) or ZIP (red) synergy models. Values below 0 indicate antagonism, 0 indicates additive effect and above 0 indicates synergy. Pooled data from two independent experiments (n = 50) are presented as mean with box (25th to 75th percentile) and whiskers (min to max). n.s. = not significant, * = p < 0.05, ** = p < 0.01 and **** = p < 0.0001.

