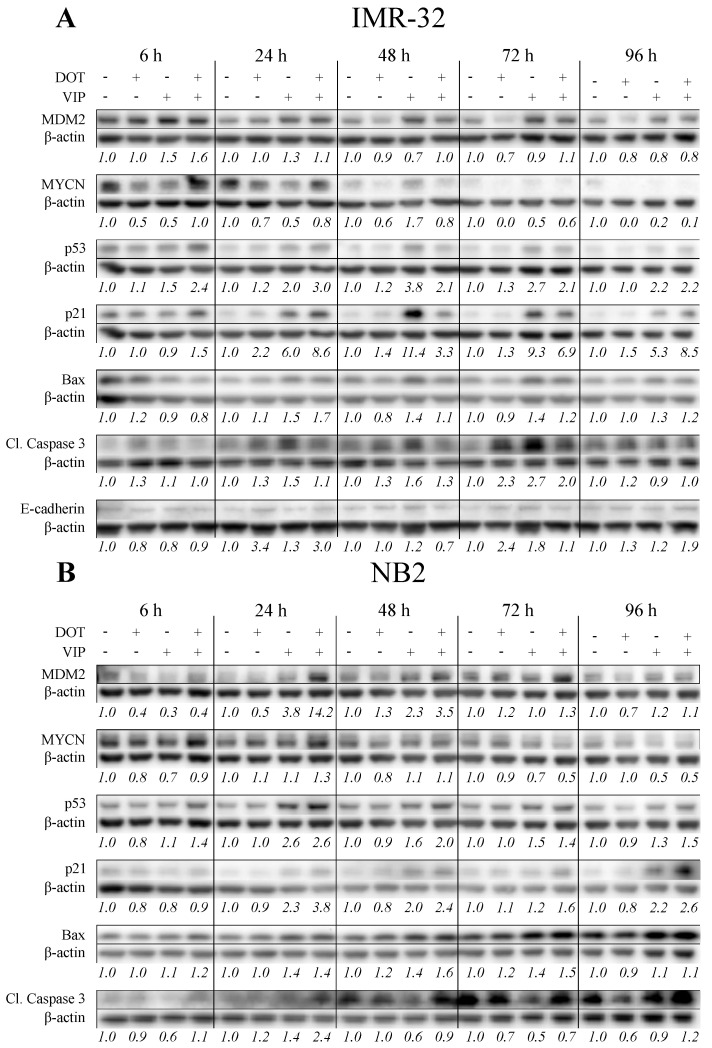
Figure 4.
Western blot. Expression of MDM2, MYCN, p53, p21, Bax, cleaved caspase 3 and E-cadherin in (A) IMR-32 and (B) NB2 6–96 h after treatment with 177Lu-DOTATATE and/or VIP116. Representative data from one experiment. Intensity values, shown below each band, was normalized against the loading control (β-actin) and the corresponding untreated control for each time point. Intensity plot from all replicates can be found in Figure S6.

