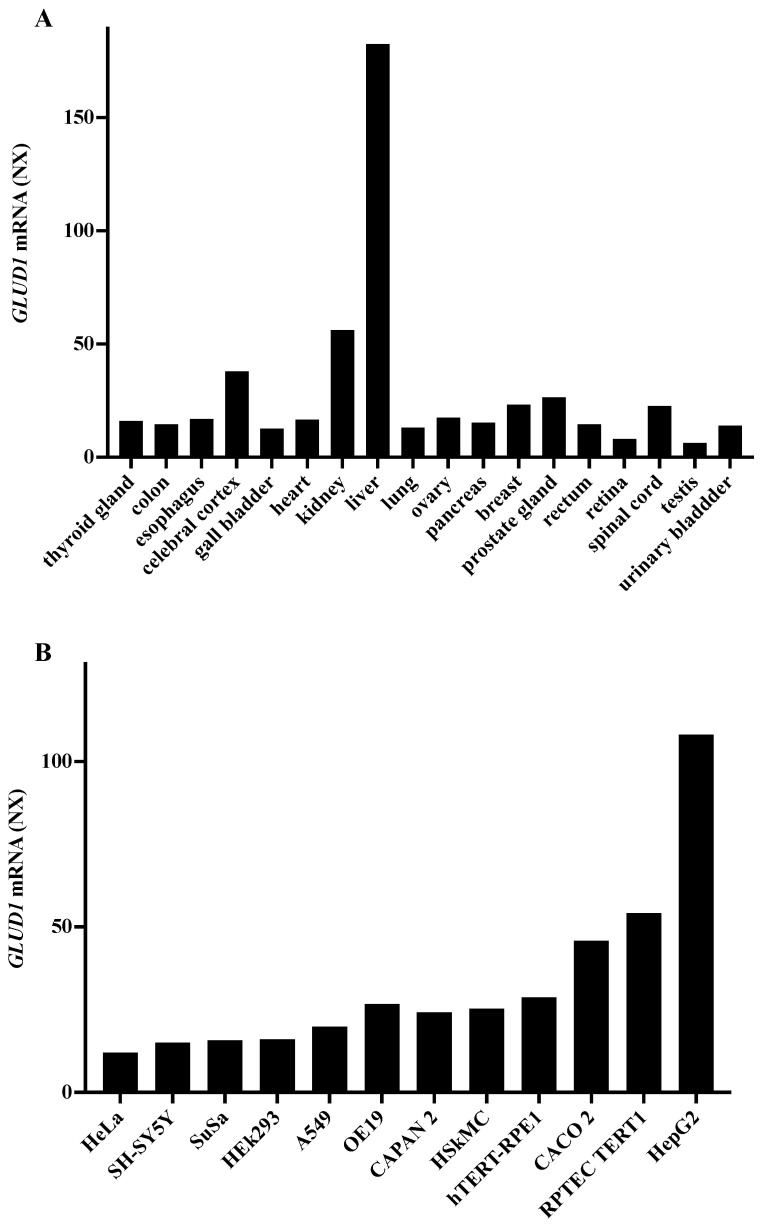
Figure 1.
GLUD1 mRNA expression: The analysis of mRNA expression profile of GLUD1 gene in different tissues (A) and cell lines (B) was obtained by consulting the database Human Protein Atlas. The keyword used to start the search was “GLUD1” https://www.proteinatlas.org/ENSG00000148672-GLUD1 (assessed on 18 September 2021). The data relating to the expression in the various tissues shown in A were acquired at this link https://www.proteinatlas.org/ENSG00000148672-GLUD1/celltype (assessed on 18 September 2021), while the data relating to expression in cell lines, (B), were extrapolated from this link https://www.proteinatlas.org/ENSG00000148672-GLUD1/cell (website: https://www.proteinatlas.org/, assessed on 18 September 2021). The data are reported as NX normalized values, where a NX value of 1.0 is the threshold value for the expression of the corresponding protein.

