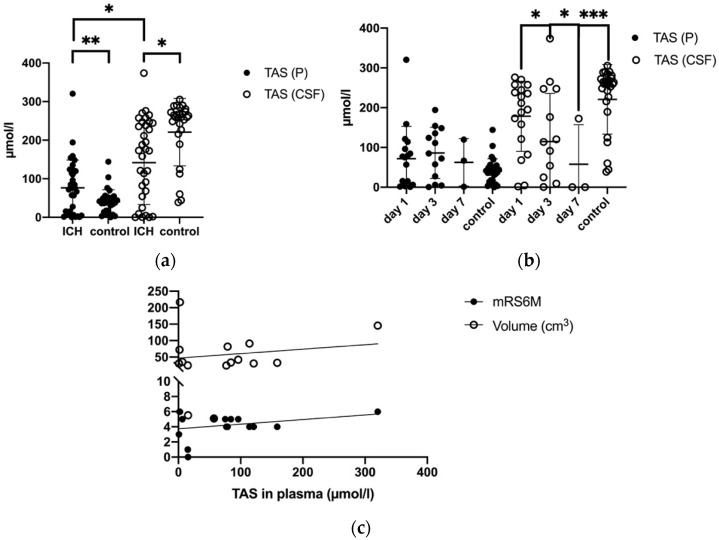
Figure 4.
(a) Comparison of mean TAS levels in plasma (P) and cerebrospinal fluid (CSF) in ICH patients and control group (b) Development of TAS levels in P and CSF in ICH patients and control group (day 1, day 3 and day 7), TAS (CSF) day 1, day 3 and day 7: p = 0.03, p = 0.03, TAS (CSF) at day 7 and control: p = 0.0001 (c) Correlation of TAS levels in P to mRS after 6 months and to the volume of ICH in ICH patients, p = ≤0.05 *, (p = <0.01 **, p = <0.001 ***).

