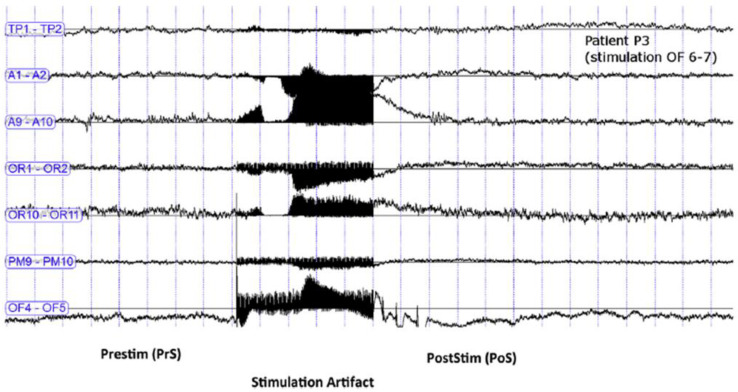
Figure 3.
Stereo-electroencephalography (SEEG) recording during a stimulation inducing an ecstatic aura, in Patient 3, showing the detail of seven bipolar channels. The figure shows the SEEG signals and the artifact of electrical stimulation applied in the insula (50 Hz, 1 ms pulse width, 1.6 mA) for 5 s. There is no visible after-discharge. Each line represents a bipolar lead representative of a brain region: TP1–2: temporal pole; A1–2: amygdala; A9–10: middle temporal gyrus; 0R1–2: orbitofrontal cortex; OR 10–11: dorsolateral prefrontal cortex; PM9–10: premotor cortex; and OF4–5: anterior insula. Adapted from a Figure published in Brain Stimulation 12(5) (2019), F. Bartolomei, S. Lagarde, D. Scavarda, R. Carron, C.G. Bénar, and F. Picard. The role of the dorsal anterior insula in ecstatic sensation revealed by direct electrical brain stimulation, page 1123, Reproduced with permission from Elsevier.

