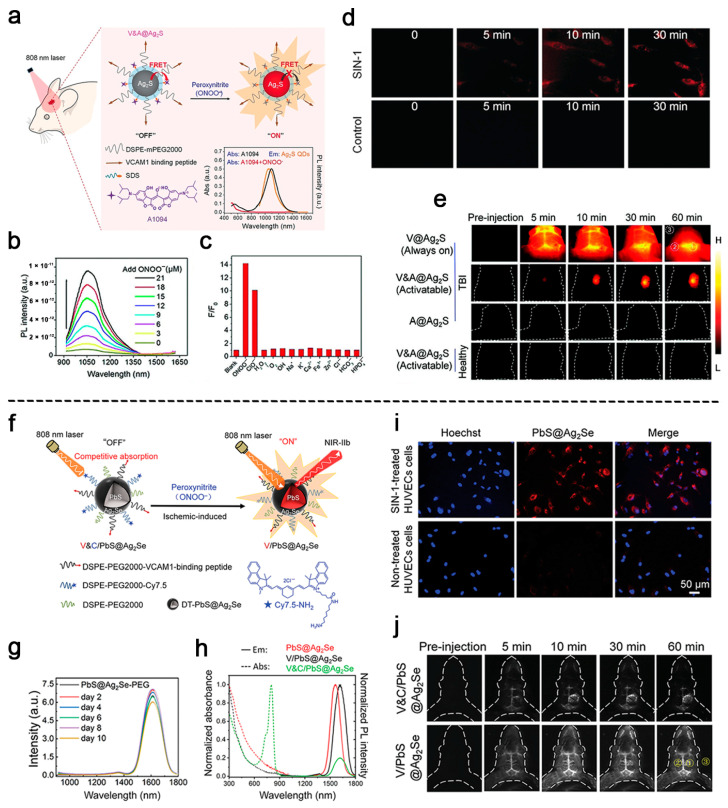
Figure 6.
(a) Schematic diagram of the preparation process of the NIR-II nanoprobe V&A@Ag2S and the mechanism of detecting ONOO− in vivo. (b) Photoluminescence spectra of V&A@Ag2S (50 μg/mL) after reaction with the different concentrations of ONOO−. (c) Fluorescence intensity ratios of V&A@Ag2S (10 μg/mL) upon the addition of different ions and RNS/ROS analytes (20 μM). (d) Fluorescence microscopy images of HUVECs after incubation with V&A@Ag2S in the presence and absence of SIN-1. (e) Time-dependent fluorescence imaging in TBI and healthy mice after different treatments. Reproduced with permission [105]. Copyright 2020, WILEY-VCH. (f) Schematic diagram of the design strategy of the NIR-II nanoprobe V&C/PbS@Ag2Se and the mechanism of detecting ONOO− in ischemic stroke model mice. (g) Time-dependent fluorescence spectra of PbS@Ag2Se-PEG QDs in PBS of pH 7.4. (h) Electronic absorption and fluorescence spectra of V&C/PbS@Ag2Se, V/PbS@Ag2Se, and PbS@Ag2Se. (i) Fluorescence microscopy images of HUVECs after incubation with V&C/PbS@Ag2Se in the presence and absence of SIN-1. (j) Time-dependent NIR-II fluorescence imaging of early ischemic stroke model mice after treatment with V&C/PbS@Ag2Se and V/PbS@Ag2Se. Reproduced with permission [109]. Copyright 2021, WILEY-VCH.

