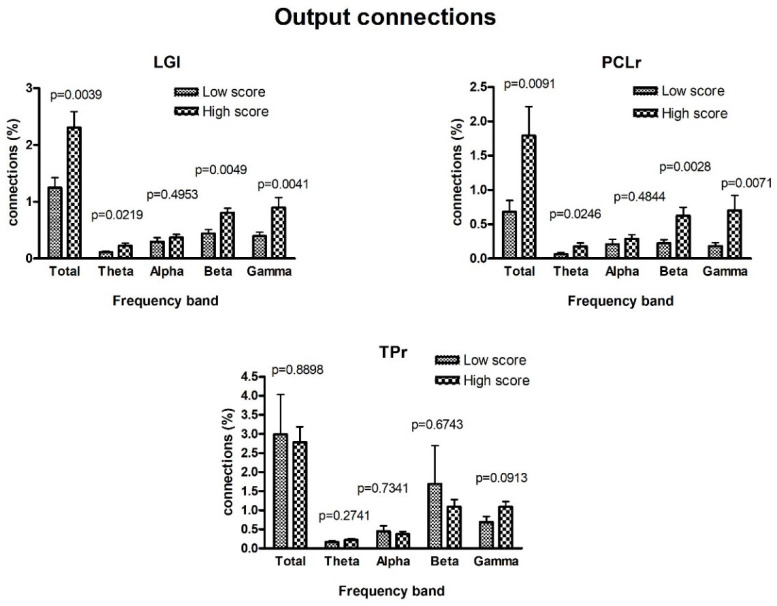
Figure 3.
Comparison between the normalized connections exiting from a given region in the two classes of subjects with lower and higher AQ scores, obtained using the spectral Granger connectivity. The comparison is performed using the overall connectivity computed in the entire frequency range () and the connectivity in the individual bands, with reference to the three regions defined as AQ-modulated source ROIs in Figure 1. Note that differences in TPr are not significant using spectral Granger causality instead of the temporal Granger causality. Moreover, differences in LGl and PCLr are highly significant in the beta and gamma bands, but not in the alpha band.

