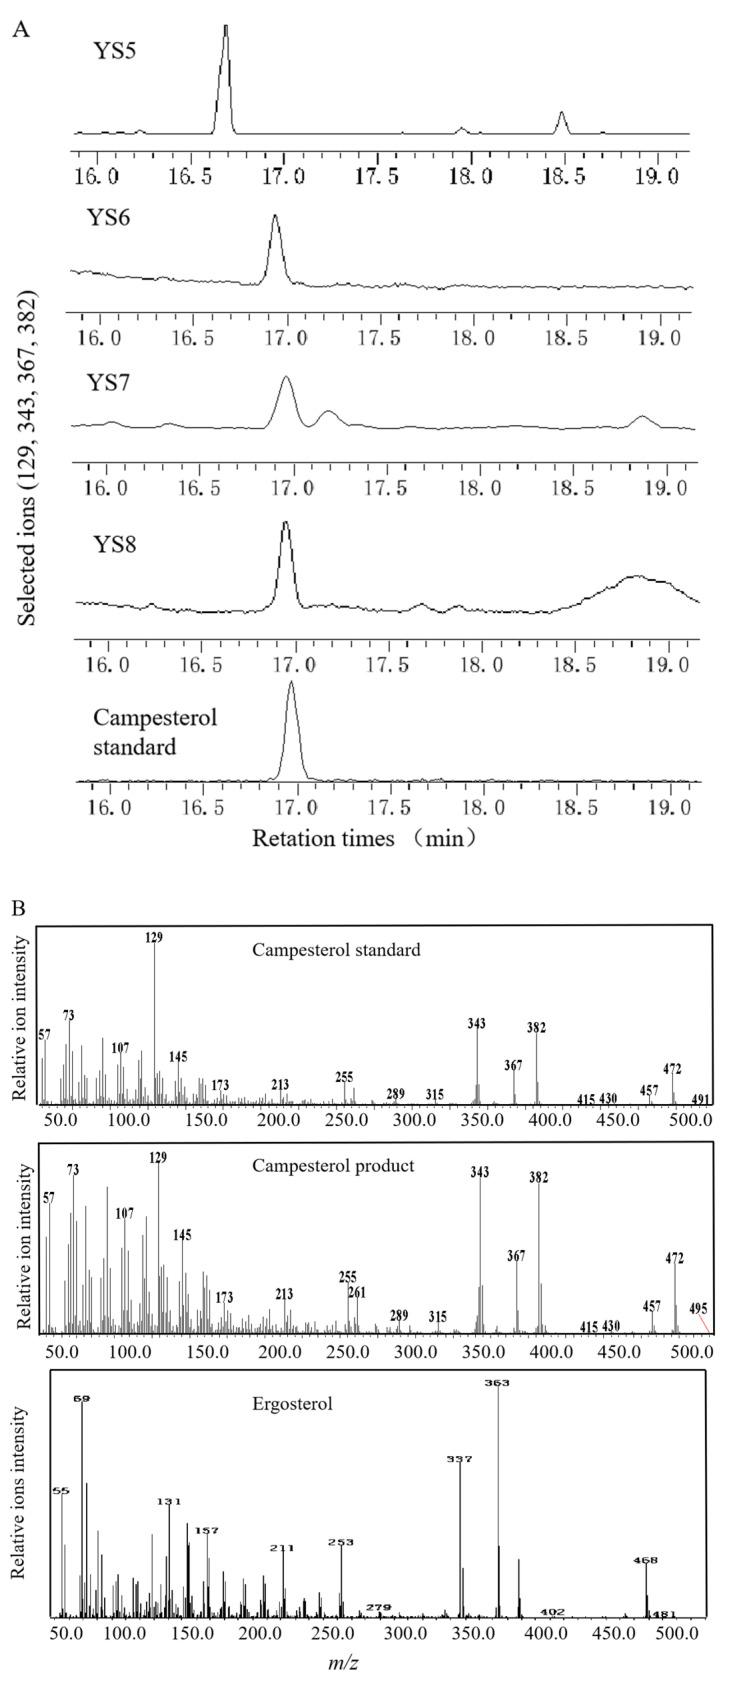
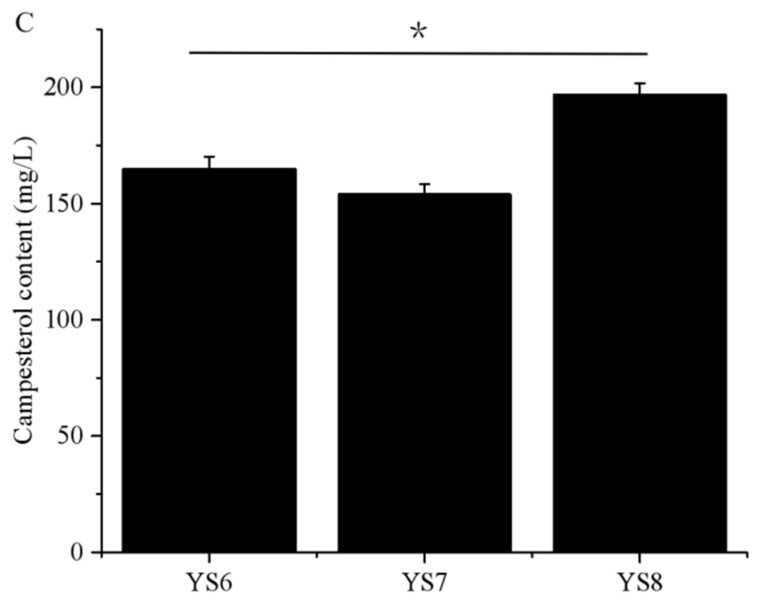
Figure 3.
Identification of fermentation products in the recombinant strains via gas chromatography–mass spectrometry (GC–MS): (A) GC–MS-extracted ion profiles of the control strain YS5 producing ergosterol and YS6–8 strains producing the campesterol product. (B) Mass-fragmented patterns of the campesterol and ergosterol products. (C) Quantification of the campesterol product extracted from the strains of YS6, YS7, and YS8. Error bars represent standard deviations (n = 3). Asterisks indicate significant differences compared to YS6 and YS7; Student’s t-test, * p < 0.05.


