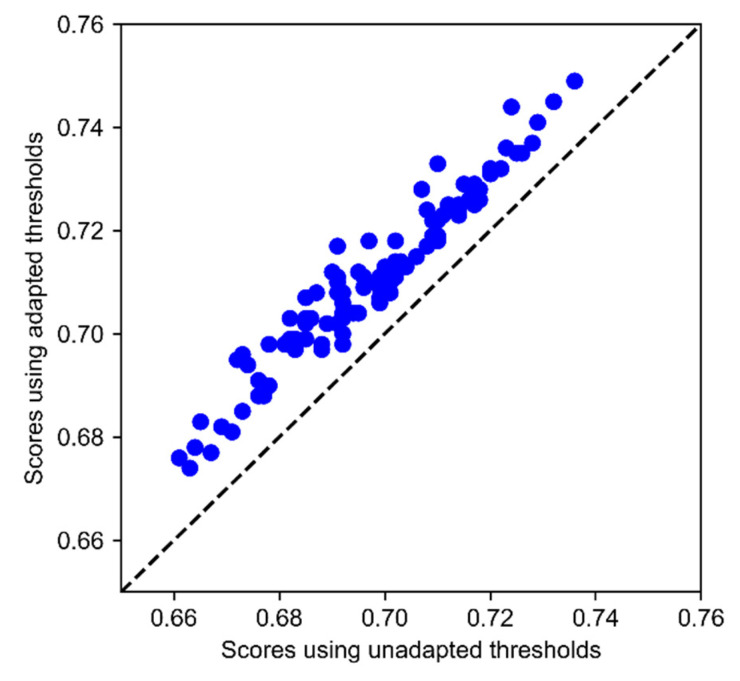
Figure 3.
The comparison between scores with and without adaptation to new cost definitions in 100 simulated cost changes. The x-axis indicates the scores that are achieved by CICST using the original cost definitions, while the y-axis indicates the scores that are achieved by CICST using the updated cost definitions. Each solid circle in the figure represents a simulated cost change.

