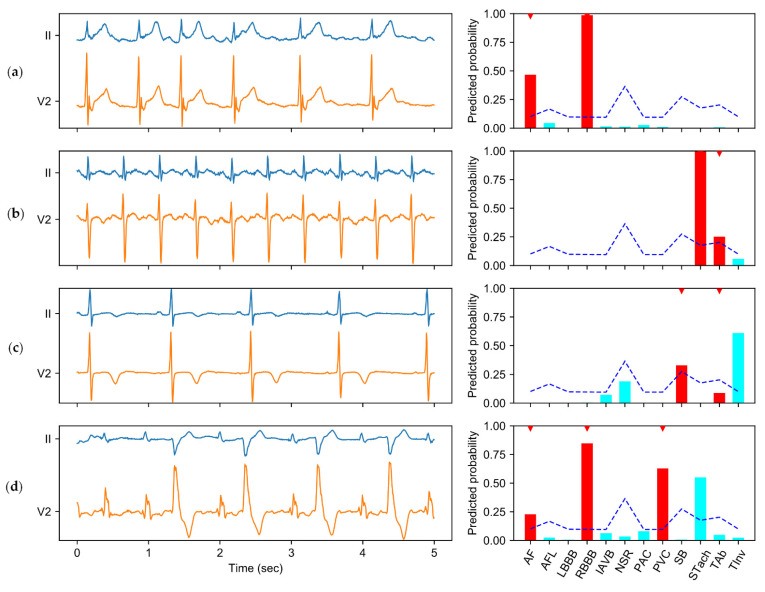
Figure 5.
Instances of ECG recording and model predictions. The subgraph on the left of each row shows the ECG signal (including lead II and lead V2), while the subgraph on the right shows the model predictions for the left ECG signal. The predicted probabilities for the physician-annotated labels are in red bars and marked with red downward triangles above the bars, while the predictions for other labels are shown in the cyan bars. The thresholds calculated by CICST are shown in blue dashed lines. Four instances are shown in this figure: (a) an ECG recording with annotated labels of atrial fibrillation (AF) and right bundle branch block (RBBB); (b) an ECG recording with labels of sinus tachycardia (STach) and T-wave abnormal (TAb); (c) an ECG recording with labels of sinus bradycardia (SB) and TAb; and (d) an ECG recording with labels of AF, RBBB, and premature ventricular contraction (PVC). This figure also shows the predicted probabilities for other labels, including atrial flutter (AFL), left bundle branch block (LBBB), first-degree atrioventricular block (IAVB), normal sinus rhythm (NSR), premature atrial contraction (PAC), and T-wave inversion (TInv).

