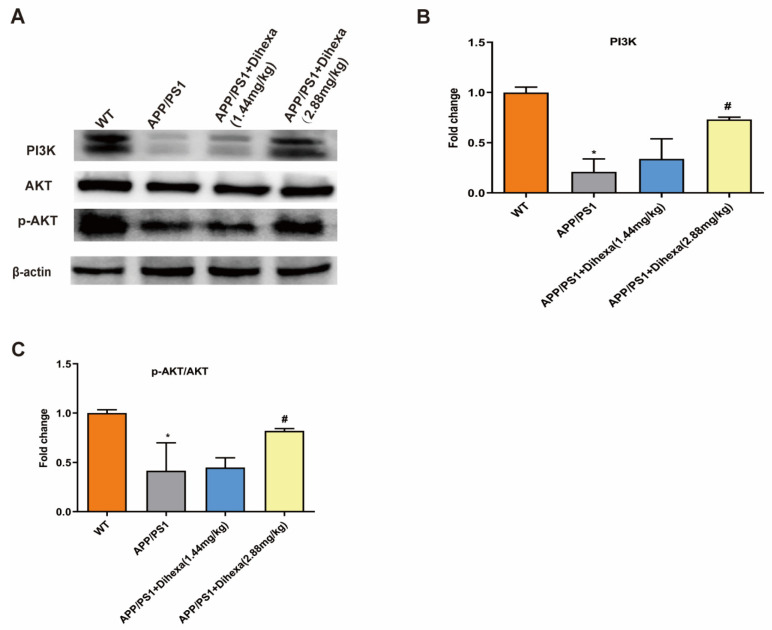
Figure 5.
Dihexa activated the PI3K/AKT signaling pathway in the brains of APP/PS1 mice. (A) Expression of PI3K, AKT, and p-AKT proteins. (B,C) Densitometric analysis of PI3K and p-AKT protein expression. All data were analyzed by one-way ANOVA followed by Tukey’s post hoc test. Columns represent mean ± SD (n = 6 per group). * p < 0.05, vs. age-matched vehicle-treated WT control mice. # p < 0.05 vs. vehicle-treated APP/PS1 mice.

