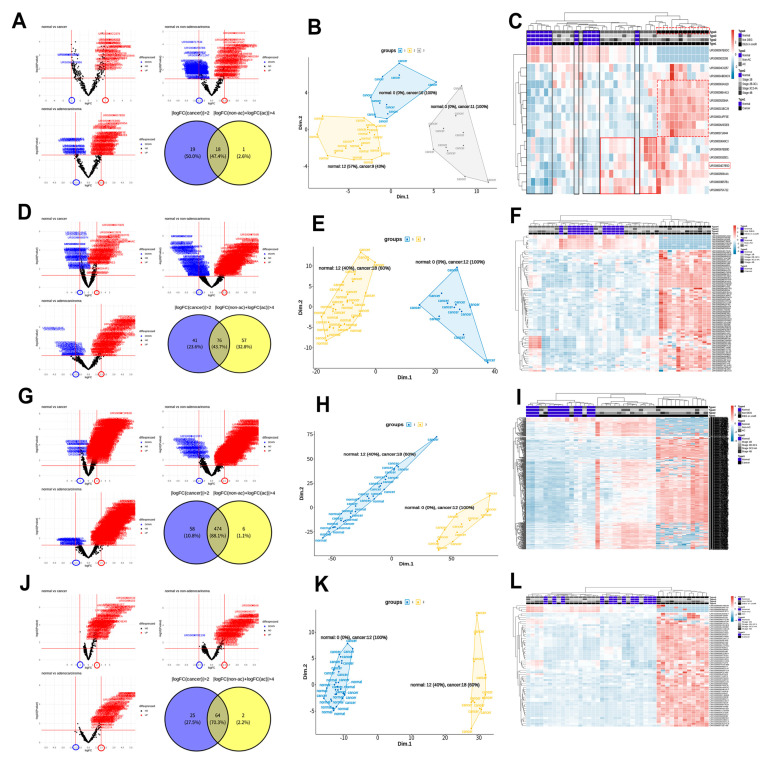
Figure 3.
Statistical screening of exosome snoRNAs, snRNAs, tRNAs, and yRNAs for the diagnosis of cervical cancer. (A) Volcano plots and a Venn diagram of 18 selected snoRNAs. (B) A clustered multidimensional scaling (MDS) scatter plot for 42 samples using the 18 snoRNAs. (C) A heatmap of the 18 snoRNAs in the normal and cancer groups. (D) Volcano plots and a Venn diagram of the selected 76 snRNAs. (E) A clustered MDS scatter plot of the 42 samples using 76 snRNAs. (F) A heatmap of the 76 snRNAs measured in the normal and cancer groups. (G) Volcano plots and a Venn diagram of the selected 474 tRNAs. (H) A clustered MDS scatter plot of the 42 samples using 474 tRNAs. (I) A heatmap of the 474 tRNAs in the normal and cancer groups. (J) Volcano plots and a Venn diagram of the selected 64 yRNAs. (K) A clustered MDS scatter plot of the 42 samples using the 64 yRNAs identified. (L) A heatmap of the 64 yRNAs in the normal and cancer groups.

