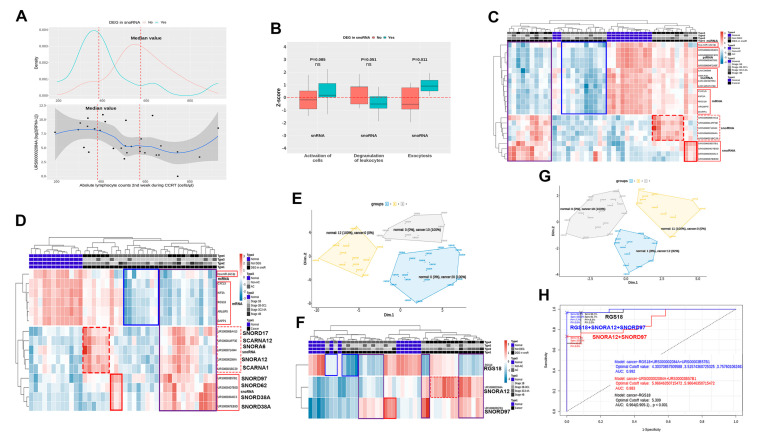
Figure 5.
(A) Association between the log2(RPM+1) value of SNORA12 and the absolute lymphocyte counts in the second week of concurrent chemoradiotherapy according to the DEGs in snoRNA. (B) Subcategories that show the difference in Z-scores according to the DEG, in snoRNA in snoRNA or snoRNA. (C) An integrated heatmap of one miRNA, four piRNAs, four lncRNAs, five mRNAs, and nine snoRNAs that were selected through the screening process. (D) A heatmap and (E) a clustered multidimensional scaling (MDS) scatter plot of the combination of one miRNA, five mRNAs, and nine snoRNAs that can distinguish between the normal and cancer groups. (F) A heatmap and (G) a clustered multidimensional scaling (MDS) scatter plot of the combination of RGS18, SNORA12, and SNORD97, which can distinguish between the normal and cancer groups. (H) Three receiver operative characteristics curves of RGS18 (black), RGS18+SNORA12+SNORD95 (blue), and SNORA12+SNORD95 (red).

