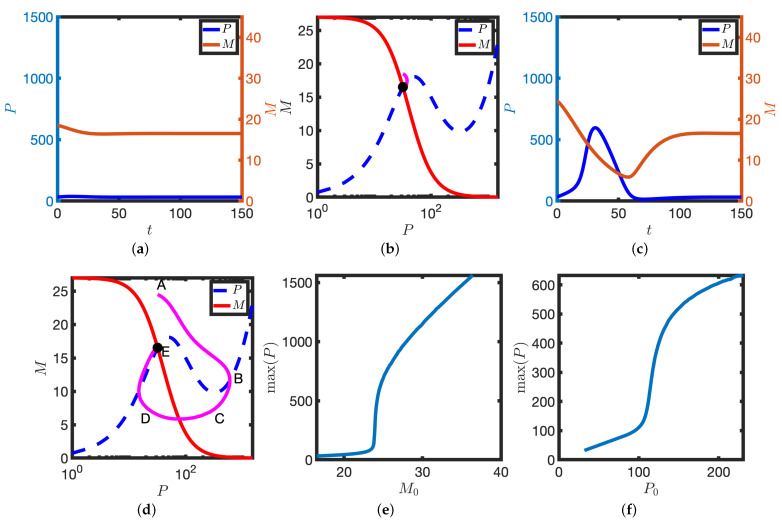
Figure 3.
Excitable solutions in the case of an intermediate transcription rate. (a,b) Solution dynamics upon making a small initial perturbation about the steady state. P and M are plotted against time, t, (a) and in the phase plane (b). (c,d) Solution dynamics upon making a large initial perturbation about the steady state. Other details as in (a,b). (b,d) Magenta lines represent solutions in the phase plane. P nullclines (dashed blue lines), M nullclines (solid red lines), steady states (black dots). (e) is plotted against the initial number of mRNA molecules, . (f) is plotted against the initial number of protein molecules, . . Equation (2) were solved numerically. Other parameter values as in Table 1.

