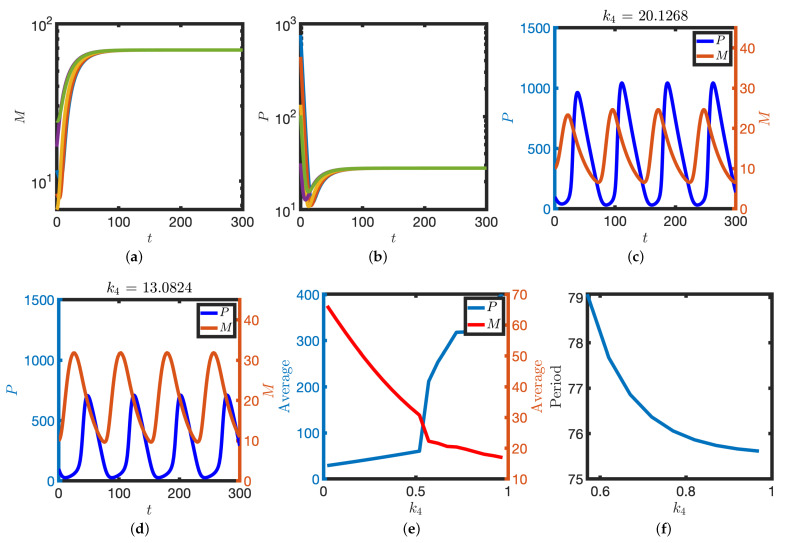
Figure 9.
Perturbation of translation rates. (a,b) X-dependent translation is blocked (). mRNA (a) and protein (b) levels are plotted against time. Initial conditions given by each of the markers in Figure 7a. (c–f) Partial block of translation rates. M and P are plotted against time for larger (c) and smaller (d) translation rates. (e) Time-averaged levels of M and P (Equation (4)) are plotted against the parameter . (f) The period of the oscillator is plotted against the parameter . Equation (2) were solved numerically. Other parameter values as in Table 1.

