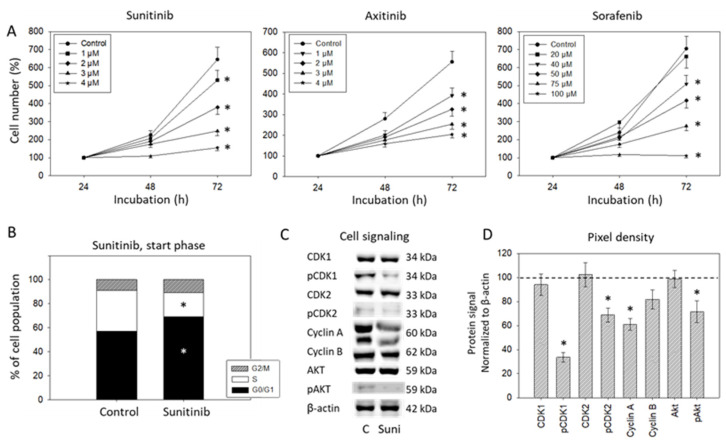
Figure 2.
(A) Dose-response analysis. HUVECs were incubated with different concentrations of sunitinib, axitinib or sorafenib, and cell number was evaluated after 24 (100%), 48 and 72 h by MTT assay. Means and standard deviation are indicated, n = 3, * = p ≤ 0.05. (B) Influence of 2 µM sunitinib on G0/G1-, S- and G2/M-phases of the cell cycle in HUVEC after 24 h (n = 3). * indicates significant difference to untreated controls. (C) Protein profile of cell-cycle-regulating proteins after exposure to 2 µM sunitinib (Suni). Controls (C) were untreated (0 µM sunitinib). One representative of three separate experiments is shown. Each protein analysis was accompanied by a β-actin loading control. One representative internal control is shown. (D) The ratio of protein intensity/β-actin intensity was calculated and expressed as a percentage of the controls, set to 100%. * indicates significant difference to controls, p ≤ 0.05. n = 3.

