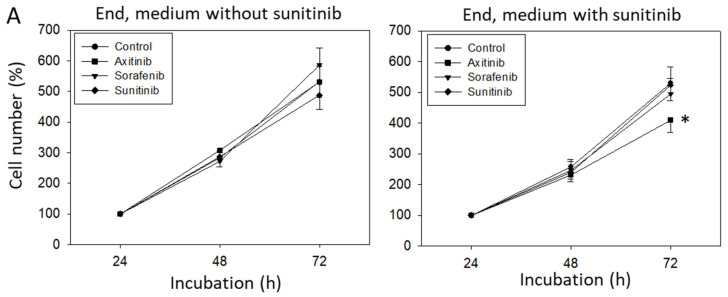
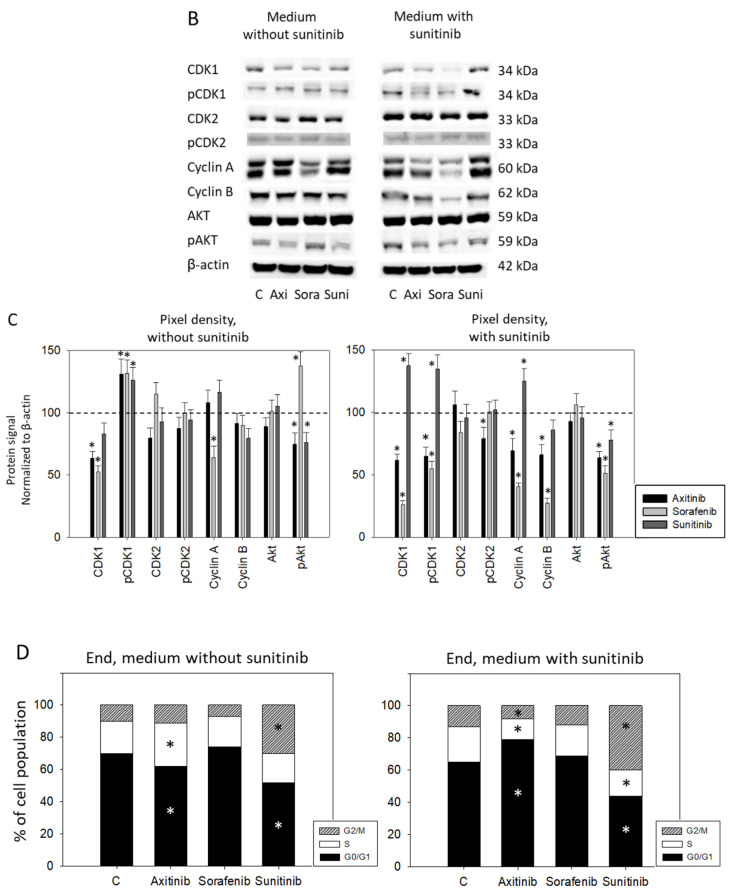
Figure 4.
(A) Cell growth analysis by the MTT assay. HUVECs were incubated with sunitinib for 6 weeks and then switched to axitinib or sorafenib for a further 6 weeks (End, medium with sunitinib). In parallel, HUVECs were incubated with sunitinib for 6 weeks and incubated for a further 6 weeks with sunitinib (Sunitinib) or with culture medium alone (Control). Figure 4A, “End, medium without sunitinib” indicates cell growth behavior of HUVECs incubated with medium alone for 6 weeks and then switched to axitinib or sorafenib for 6 weeks. In parallel, HUVECs were incubated with cell culture medium for 6 weeks and then incubated for a further 6 weeks with sunitinib (Sunitinib) or with culture medium alone (Control). * indicates significant difference to untreated controls (n = 6). (B) Protein profile of cell-cycle-regulating proteins after 6 weeks sunitinib (Medium with sunitinib) or cell culture medium alone (Medium without sunitinib) followed by a 6 week switch to axitinib (Axi), sorafenib (Sora), to a further 6 weeks sunitinib (Suni) or 6 weeks culture medium alone (C). Each protein analysis was accompanied by a β-actin loading control. One representative internal control is shown. (C) The ratio of protein intensity/β-actin intensity was calculated and expressed as a percentage of the controls, set to 100%. * indicates significant difference to controls, p ≤ 0.05. n = 3. (D) Cell cycle analysis after 6 weeks incubation with sunitinib (End, medium with sunitinib) or cell culture medium alone (End, medium without sunitinib) and subsequent 6 week incubation with axitinib, sorafenib, sunitinib or culture medium alone (C) (n = 3). * indicates significant difference to untreated controls.


