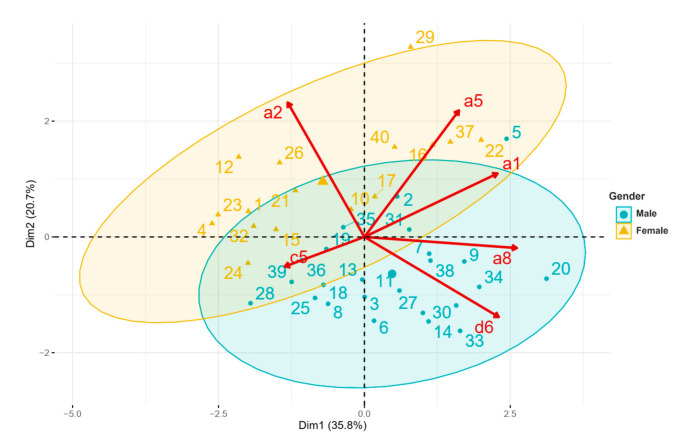
Figure 1.
Principal component analysis biplot. Participants with DS are represented from 1 to 40. a1: age, a2: gender, a5: BMI (body mass index), a8: gonial angle, c5: daily steps number (accelerometry), d6: AHI (apnea-hypopnea index, PSG). On the biplot representation (Figure 1), a subject on the same side as a given variable obtained a high score for this variable. A low value for this variable was attributed to a subject on the opposite side. For example, a participant positioned near item d6 (case #33) presented a mean AHI of 76.69 events/h, and a participant on the opposite side (case #26) presented a mean AHI of 8.83 events/h.

