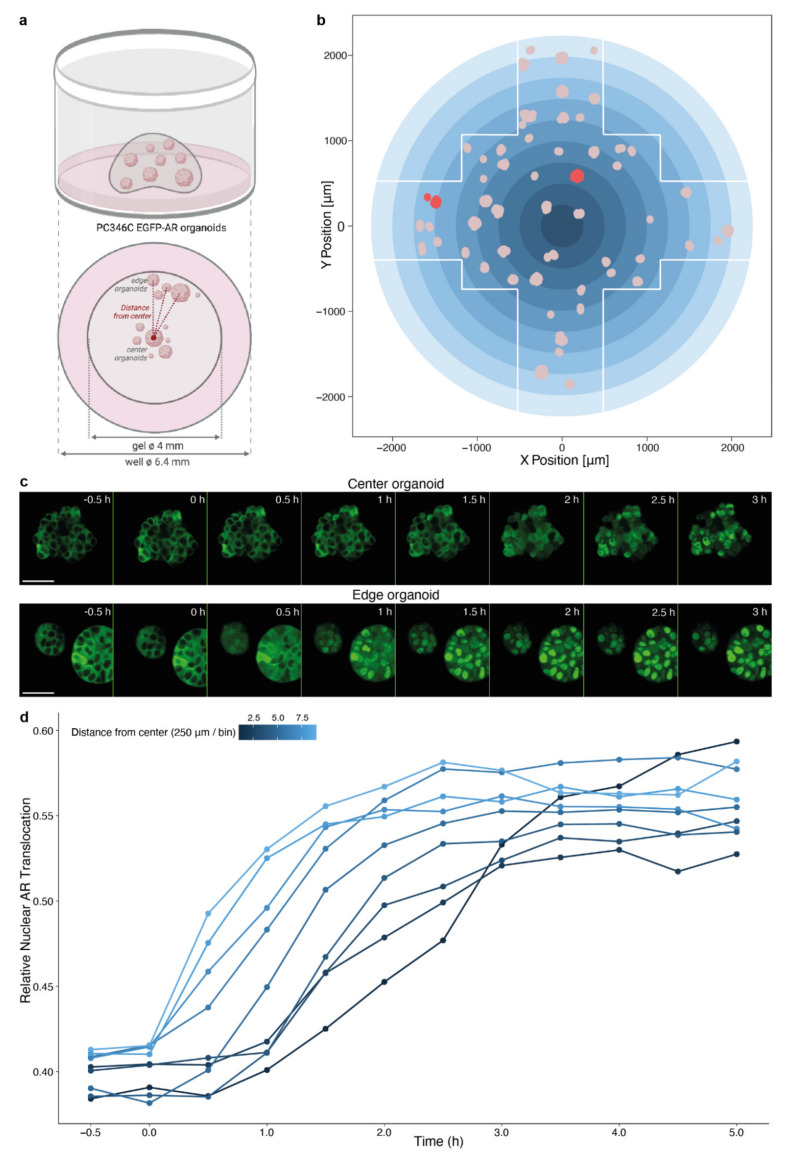
Figure 4.
Impact of spatial organoid distribution within a Matrigel dome on androgen-induced AR translocation. (a) Schematic representation of experimental design. (b) Illustration of organoid distribution within a single imaged well, based on the X position and Y position. White lines delineate the imaging field. Pink dots depict organoids, red dots are the organoids shown as example in (c). Gradient blue circle represents bins applied in (d). (c) Representative images of androgen-induced AR translocation in a PC346C EGFP-AR organoid located at the center (top panel) or edge (bottom panel) of the Matrigel dome following exposure to synthetic androgen (10 nM R1881). Time after exposure is indicated in the right upper corner of each image. Scale bars indicate 50 µm. (d) Image-based quantification of nuclear AR translocation in organoid cells grouped in nine bins of ~250 µm, based on the distance from the center of the well as depicted in (b). 10 nM R1881 was added to organoid medium at 0 h. Data points represent the average of four imaged wells.

