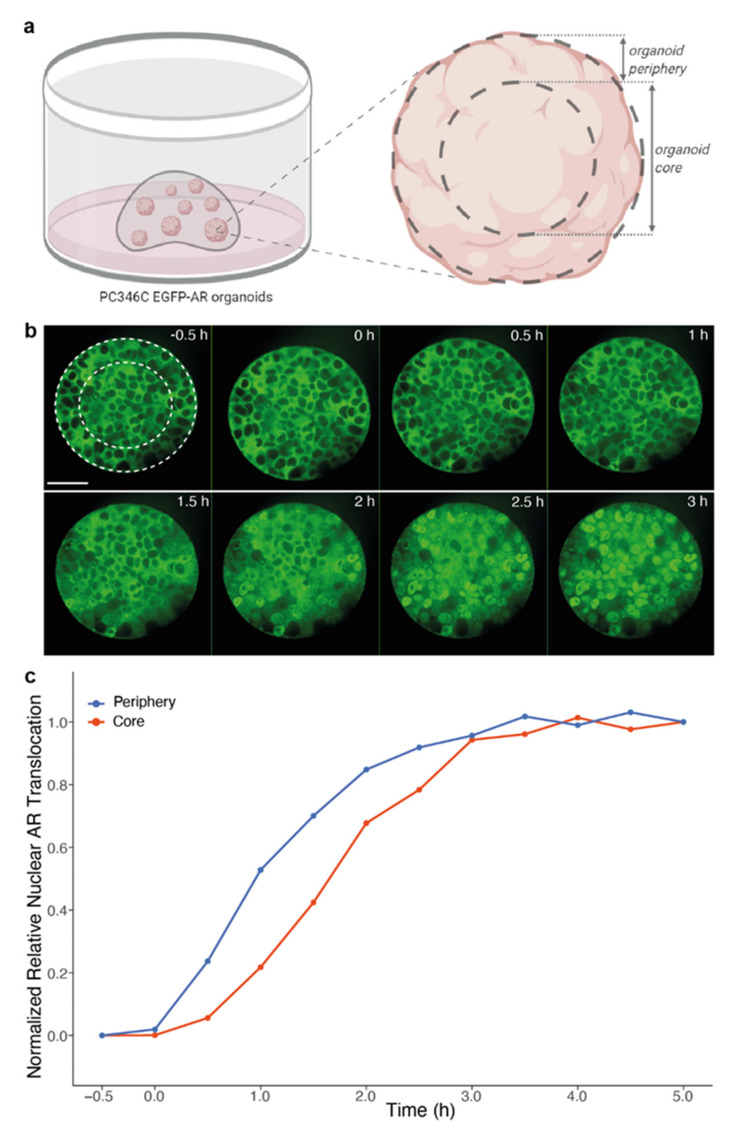
Figure 5.
Impact of organoid size on androgen-induced AR translocation. (a) Schematic overview of segmentation within individual organoids. (b) Representative images of androgen-induced AR translocation within a single PC346C EGFP-AR organoid. Time after exposure to 10 nM R1881 is indicated in the right upper corner of each image. White dotted circles represent segmentation in organoid core versus organoid periphery. Scale bar indicates 50 µm. (c) Image-based quantification based on the segmentation within individual organoids depicted in (a) and (b). Nuclei located inside an outer rim of 100 pixels from the organoid circumference were allocated to the organoid periphery, nuclei located inwards of this organoid periphery (thus > 100 pixels from the organoid circumference) were allocated to the organoid core. Curves represent the normalized relative nuclear AR translocation in cells from large organoids (with a cross-sectional area > 8000 µm2) from five imaged wells (n = 47 organoids). Curves were normalized to allow direct comparison of the dynamics of AR translocation between the often dimmer, low-contrast organoid core and the brighter, high-contrast organoid periphery (p < 0.0001 at 1 h; p < 0.0001 at 2 h, unpaired t test, two-tailed).

