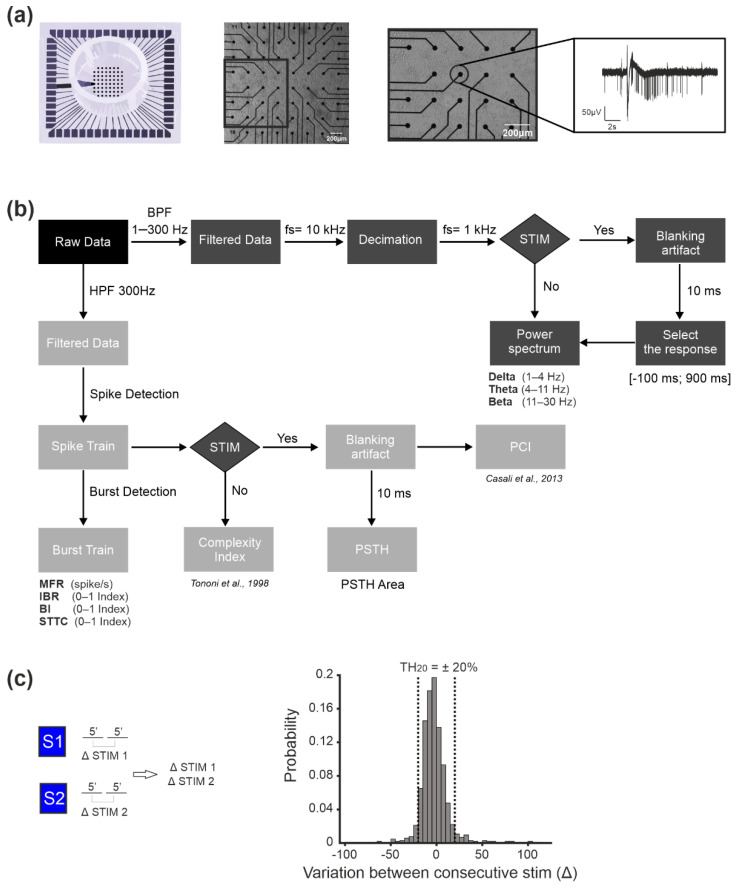
Figure 1.
Methods of our experiments. (a) From left to right: cartoon of a 60–channel micro-electrode array (MEA) by MCS with a standard electrode layout (8 × 8); optical micrograph of a MEA plated with cortical cultures (scale bar 200 µm); zoom of the squared area highlighted in the previous picture (scale bar 200 µm); a typical raw trace recorded from a representative micro-electrode of the MEA. (b) Scheme of the data analysis workflow. Data were acquired by means of the MC_Rack software (MCS). We then processed it by following two approaches: (i) by band pass filtering in the frequency band 1–300 Hz, we obtained filtered data which was then decimated at 1 kHz, i.e., the local field potentials (LFPs); (ii) by high pass filtering (>300 Hz) we obtained filtered data which were processed by means of a spike detection algorithm, to obtain the multi-unit activity (MUA). The MUA was further analyzed to detect firing and bursting parameters and to compute the correlation index, in the form of the spike time tiling coefficient (STTC). For both (i) and (ii), we analyzed the spontaneous as well as the evoked activity (see Methods for details on the analysis). (c) Selection of the PSTH threshold during the stability phases (see Methods). On the left, the variation in the PSTH area in the basal condition is computed by considering the responses to stimulation in the first and in the second five-minute time frames. The variation in the percentage of the PSTH area for all the channels in all the experiments was then plotted as a histogram (rigth panel) which served to define the ‘natural’ fluctuation range of the considered parameter. The threshold was then defined as the mean ± 1SD of the PSTH area variation of the obtained histogram, which resulted I being equal to ± 20%. We then named that threshold TH20.

