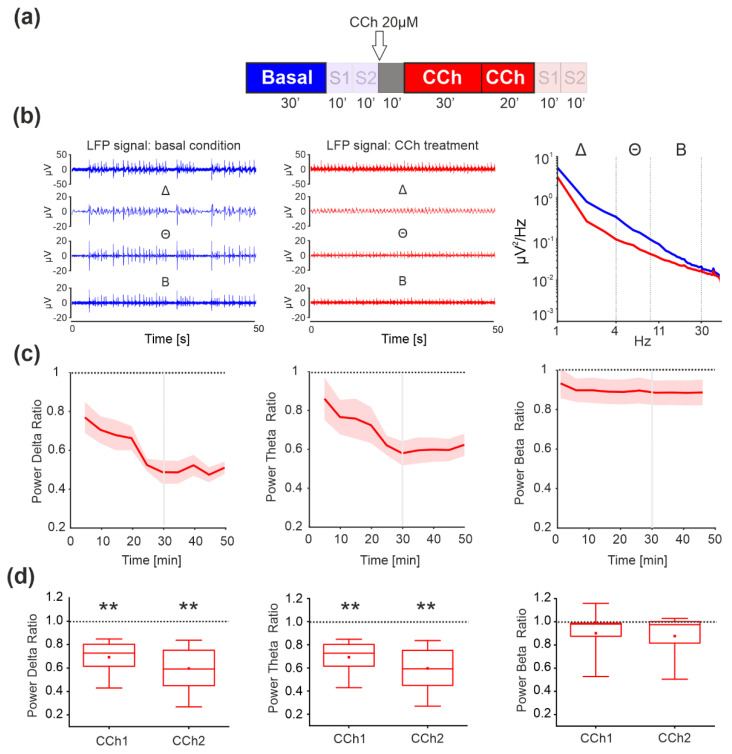
Figure 2.
Analysis of local field potentials (LFP) during the basal and CCh phases, to evaluate differences in spontaneous activity. (a) Experimental protocol adopted for the experiments. The spontaneous phases (i.e., without electrical stimulation) analyzed here are highlighted. Cortical cultures were recorded for 30′ under basal conditions followed by 1 h of recording after the addition of 20 μM CCh. (b) Signal filtered to specific frequency bands involved in sleep for one channel of a representative experiment: local field potential (LFP) signals obtained after band-passing the raw data in the range 1–300 Hz. Different components of the LFP: delta frequency signal (Δ, 1–4 Hz), theta frequency signal (Θ, 5–9 Hz), and beta frequency signal (Β, 10–30 Hz). CCh treatment induced suppression of all low-frequency waves compared to the control condition in one representative experiment (right panel). (c) Time course of the power spectral density ratio (CCh over basal) computed in delta, theta, and beta power. (d) Box plot comparison of the PSD of each band showing a marked decrease in the delta and theta bands (n = 9 MEAs recorded, p = 10−5). We did not find any difference in the PSD in the beta bands. The bold lines and shaded regions in (c) correspond to the mean ± SEM. In each box plot, the small red square indicates the mean, the central red line illustrates the median, and the box limits indicate the 25th and 75th percentiles. Whiskers represent the 5th and the 95th percentiles. Statistical analysis was conducted using the Mann–Whitney comparison test; * p < 0.05; ** p < 0.01.

