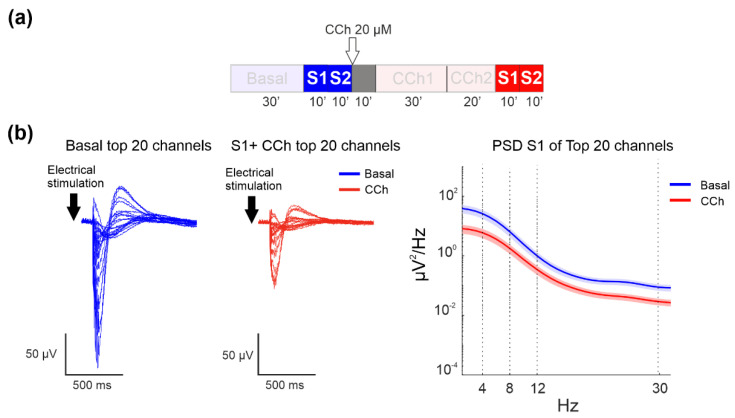
Figure 5.
LFP analysis of the evoked response. (a) Experimental protocol adopted for the experiments. The electrical stimulation phases analyzed here are highlighted. Cortical cultures were stimulated for 10 min at two different sites under basal conditions and after CCh treatment. (b) Left panel: Mean evoked responses of the top 20 channels in one representative experiment during basal conditions and after CCh administration. Right panel: Comparison of the mean PSD of the two different experimental phases: the bold lines and shaded regions correspond to the mean ± SEM.

