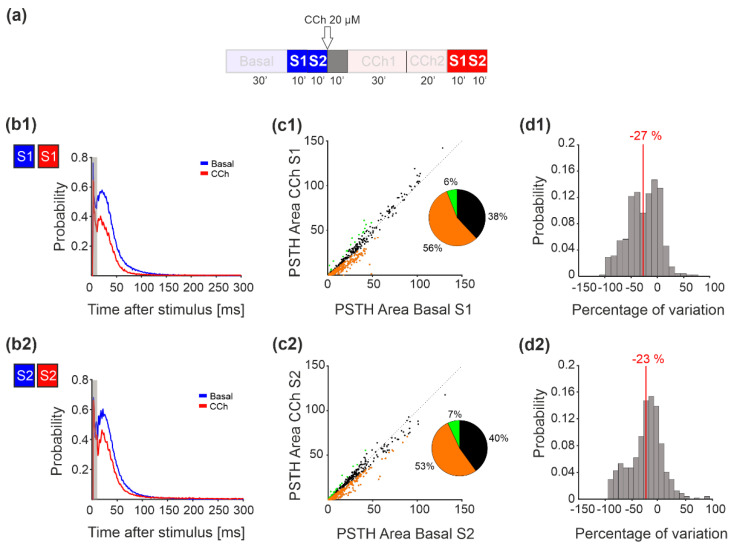
Figure 6.
PSTH area analysis. (a) Experimental protocol adopted for the experiments. The stimulation phase analyzed here is highlighted. Cortical cultures were stimulated for 10 min at two different sites under basal conditions and after CCh treatment. (b) Network PSTH measured in one representative experiment during both stimulation sessions under basal conditions (blue lines) and after CCh treatment (dark red lines). (c) The PSTH area of all the experiments for both stimulation sessions showed a higher percentage of channels that decreased relative to the basal level. The variation in each channel was considered significant if it was greater than 20% of the threshold computed by measuring the variation during the stability phases. Orange dots indicate channels that decreased with respect to the basal conditions, green dots indicate channels that increased, and black channels are the ones that did not change. (d) The histogram of the percentage of variation for both stimulation sessions showed a mean value centered at −27 for stimulus 1 and at −23 for stimulus 2.

