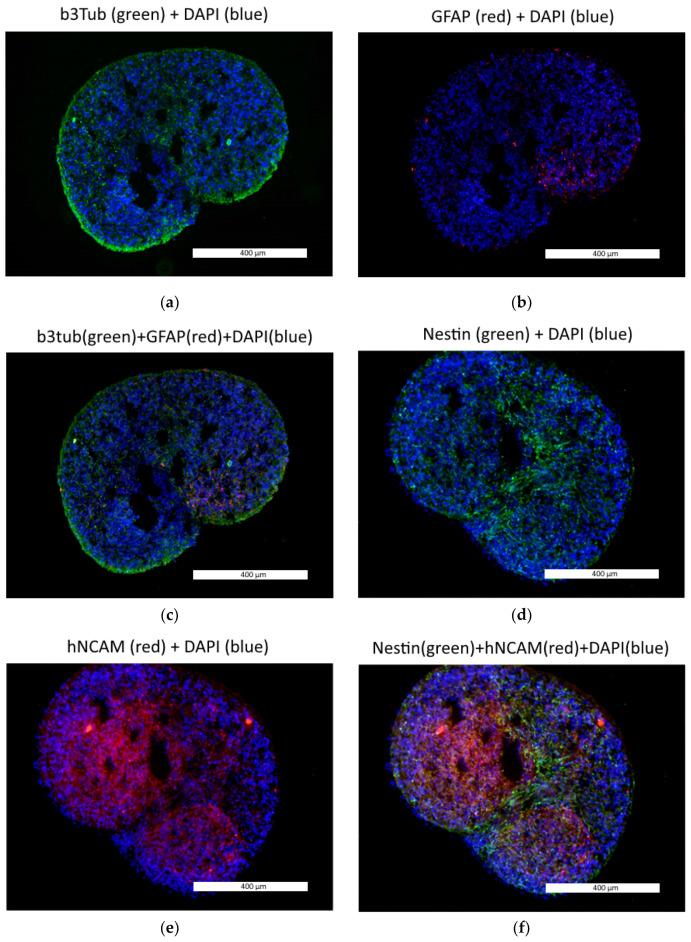
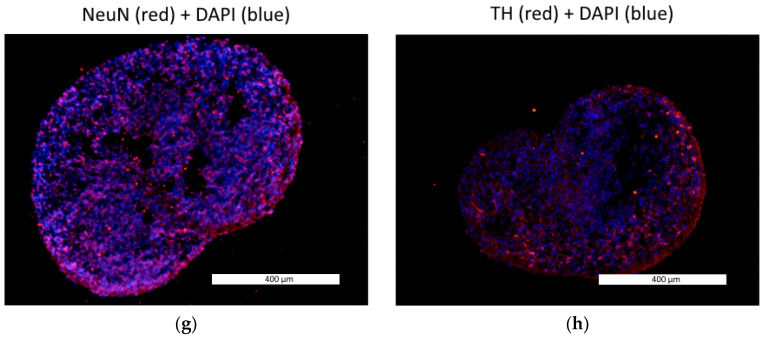
Figure 3.
The 3D neural spheroids expressed neural cell markers: (a) TUBB3 (green); (b) GFAP (red); (c) TUBB3 (green) and GFAP (red); (d) Nestin (green); (e) hNCAM (red); (f) Nestin (green) and hNCAM (red); (g) NeuN (red); (h) TH (red); DAPY-stained cell nuclei in all pictures are blue. Fluorescence microscopy, the scale length in all pictures is 400 µm.


