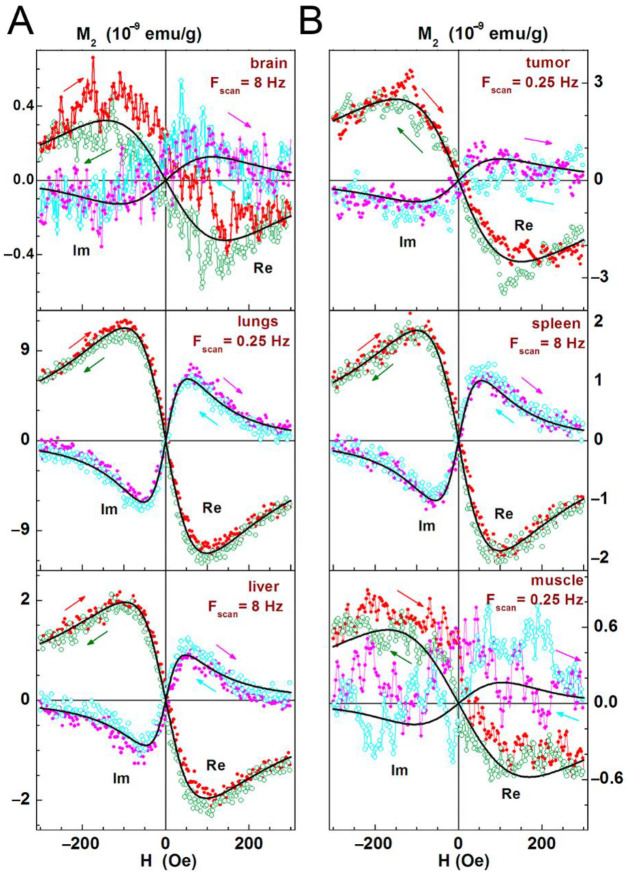
Figure 5.
Real and imaginary parts of the nonlinear magnetic response as functions of the dc magnetic field direct (filled red and magenta symbols) and reverse (open olive and cyan symbols) scans (indicated additionally by arrows of the same with symbols colours) at Fsc = 8 or 0.25 Hz, with their best fits are displayed for brain, lungs, liver (panel A), and tumor, spleen, muscle (panel B) following one day after intravenous injection of SPION-labeled MSCs. Only every 10th experimental point is shown. Obtained parameters are presented in Table 1.

