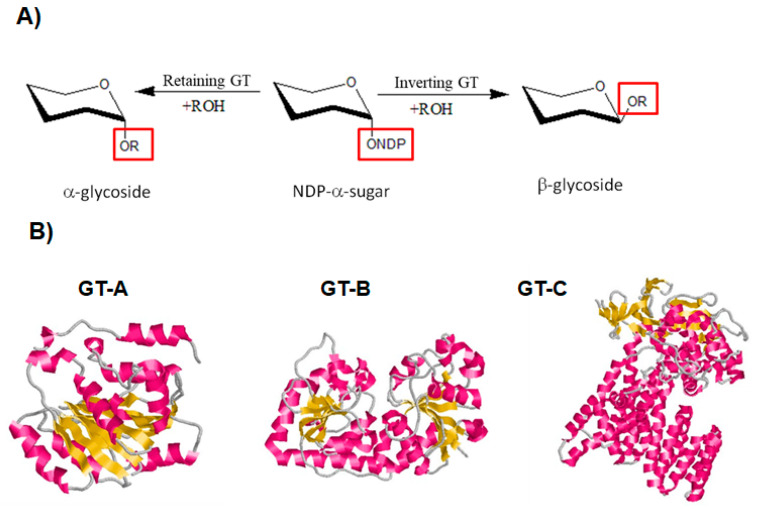
Figure 6.
Classification of GTs based on their mechanism for the catalysis of glycosyl group transfer and on their 3D structure [126,127,128]. (A) Schematic diagram showing inverting and retaining GTs. (B) Classification of GTs based on their 3D structure. Diagram of GT-A fold protein represented by SpsA protein from Bacillus subtilis (Protein Data Bank (PDB ID: 1QGQ), diagram of GT-B fold represented by the β-glucosyltransferase of bacteriophage T4, (PDB ID: 1JG7) and diagram of GT-C fold represented by the oligosaccharyltransferase protein from Campylobacter lari in complex with peptide substrate and magnesium (PDB ID: 3RCE). The helices are shown in pink, β-strands in yellow and loops in grey.

