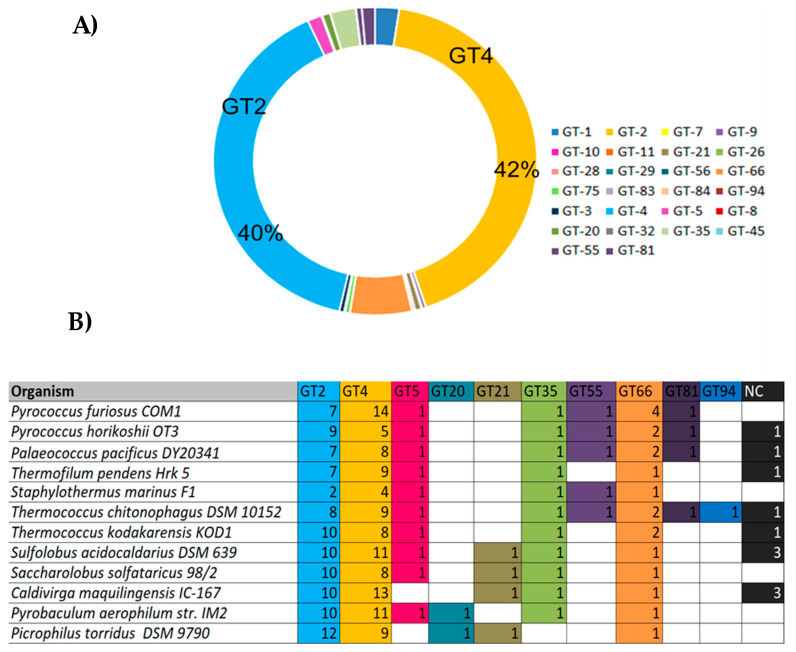
Figure 7.
Classification of most abundant archaeal GTs [20]. (A) Diagram showing the abundancy of GTs families in Archaea. The sequences from Archaea genomes corresponding to each GT family were retrieved from the CAZY database and the number of occurring sequences for each GT family was determined accordingly; (B) Occurrence of GTs in hyperthermophilic Archaea. NC: Non-classified.

