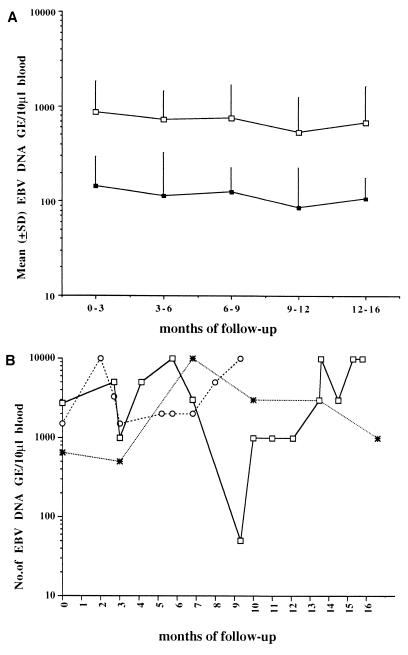
FIG. 3.
Follow-up of EBV DNA levels in 32 SOT recipients with asymptomatic EBV infections. (A) EBV DNA levels (means ± standard deviations) in 19 patients consistently showing <1,000 GE during follow-up (■) and in 10 patients with at least one blood sample in the range of 1,000 to 5,000 GE during follow-up (□). (B) Individual fluctuations of EBV DNA levels in three patients showing ≥5,000 GE in the blood at least once during follow-up.

