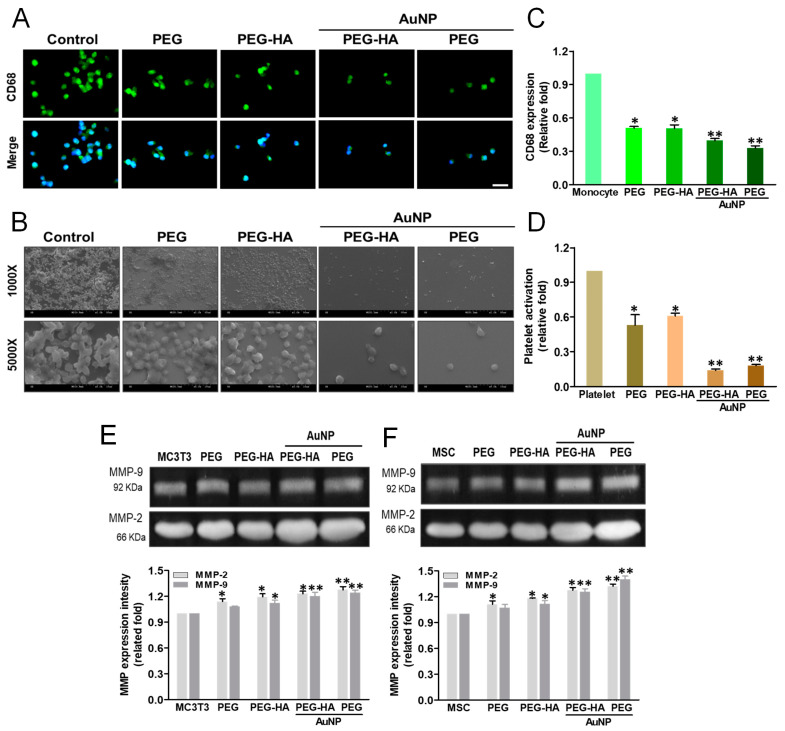
Figure 6.
Biocompatibility assay. (A) The expression of CD68 for macrophages on different materials at 96 h. Cells were immunostained by the primary anti-CD68 antibody and conjugated with the FITC-immunoglobulin secondary antibody (green color fluorescence). Cell nuclei were stained by DAPI (blue color fluorescence). Scale bar = 20 μm. (B) SEM images showing the adhesion and activation of human blood platelets on different materials. (C) CD68 expression was quantified based on fluorescence intensity. * p < 0.05: smaller than control (TCPS). (D) Quantification of the degree of platelet activation score. Data are the mean ± SD (n = 3). * p < 0.05; ** p < 0.01: smaller than control (TCPS). The MMP-2/9 enzymatic activity of (E) MC3T3 cells and (F) MSCs was increased in the PEG-HA-AuNP and PEG-AuNP groups. Semi-quantitative measurement of MC3T3 cells and MSCs shows the expression level of MMP-2/9 protein for cells on different materials after 48 h of incubation. Semi-quantitative data in the graph represent the optical density (OD) of gelatinolytic bands. Data are the mean ± SD (n = 3). * p < 0.05; ** p < 0.01: greater than control (TCPS).

