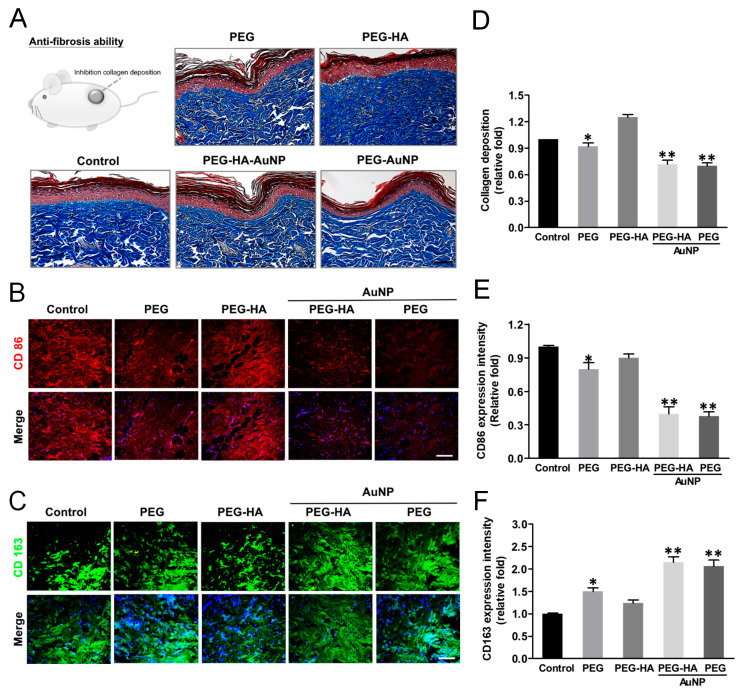
Figure 10.
Masson’s trichrome staining of (A) collagen deposition (blue color) of rat femoral artery subcutaneously implanted in an SD rat assessed the immune response of different materials at 4 weeks. Immunofluorescence staining images (marker of macrophages) in response to the implant materials. (B) CD86 (M1) = red color, (C) CD163 (M2) = green color. The scale bar represents 100 μm. Quantification of (D) collagen deposition, and (E) CD86 and (F) CD163 fluorescence intensities. Data are mean ± SD. * p < 0.05, ** p < 0.01: smaller or greater than control group (glass). The number of rats was 5 (n = 5).

