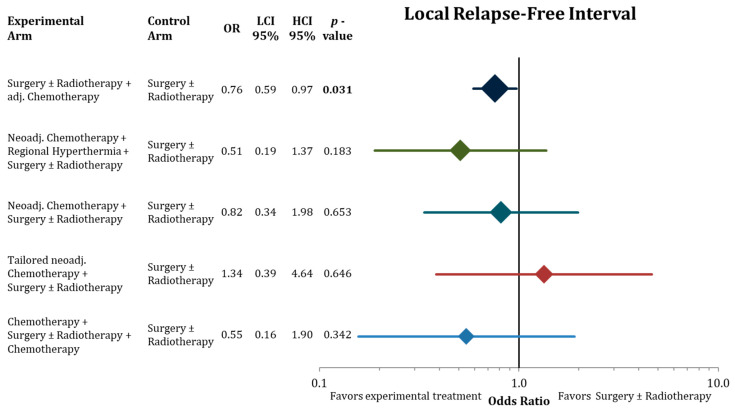
Figure 5.
Forest plot comparing local relapse-free interval in the network analysis of the experimental treatments against surgery ± radiation therapy. Hazard ratios with lower and upper 95% confidence intervals and the corresponding p-values are presented. The sizes of the diamonds are proportional to the weights in the meta-analysis. HR = hazard ratio, LCI = low limit of 95% confidence interval, and HCI = high limit of 95% confidence interval. Bold values indicate significant p-values.

