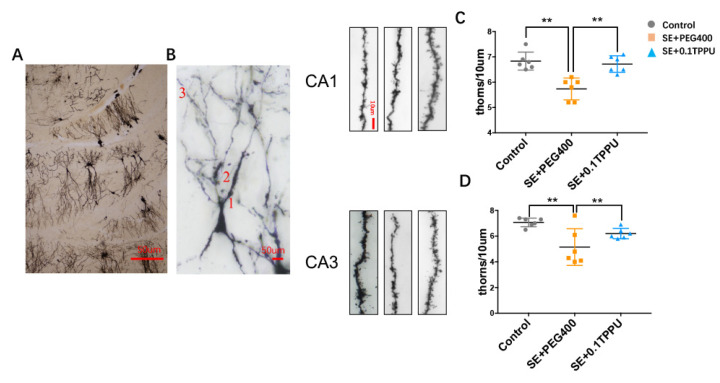
Figure 7.
(A,B) The dendritic spines density of the third branch (×20 magnification in Figure 6A, ×40 magnification in Figure 6B) in the hippocampus. (C,D) The number of dendritic spines every 10 μm length of the third branch (×60 magnification) was significantly decreased selectively in the CA1 and CA3 subareas of hippocampus in the SE+PEG400 group compared with the Control group. TPPU pre-treatment significantly recovered the dendritic spines density in the SE+0.1TPPU group compared with the SE+PEG400 group. (Figure 7A,B, one-way ANOVA test, n = 4 in every group, ** p < 0.01. CA, Cornu Ammonis.CA1, CA3: The third branch of dendritic spines in the pyramidal neurons of CA1 and CA3 subareas were photographed and analysed.

