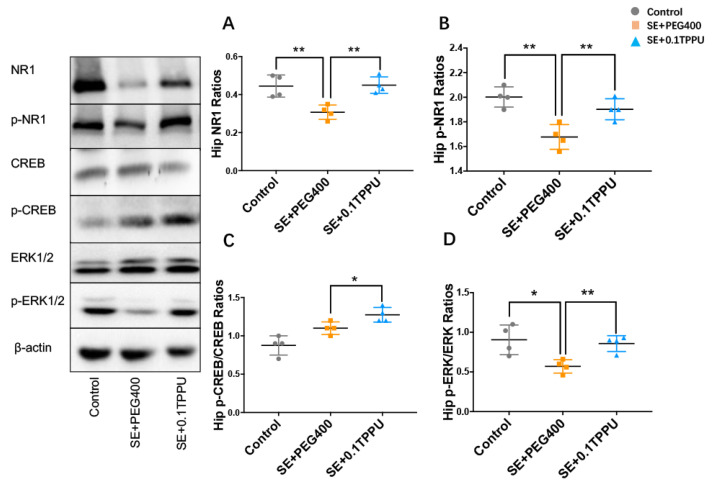
Figure 8.
(A,B) The ratios of NR1 and p-NR1 subunits of NMDA receptor was significantly decreased in the hippocampus of the SE+PEG400 group compared with the Control group, which was significantly increased in the SE+0.1TPPU group compared with the SE+PEG400 group after TPPU treatment. (C,D) The ratios of p-ERK1/2/ERK1/2 and p-CREB/CREB in the hippocampus were significantly increased in the SE+0.1TPPU group compared with the SE+PEG400 group. (Figure 8A–D, one-way ANOVA test, n = 4 in every group, * p < 0.05 ** p < 0.01). The figure on the left showed the bands of NR1, p-NR1, CREB, p-CREB, ERK1/2, p-ERK1/2, and β-actin in the Control, SE+PEG400, and the SE+0.1TPPU groups measured by the western-blot method.Hip, hippocampus; NR1, N-methy1-D-aspartate 1 receptor; p-NR1, phospho(S889)-N-methy1-D-aspartate 1 receptor; CREB, cyclic adenosine monophosphate-response element binding protein; p-CREB, phosphor (Ser133)-cyclic adenosine monophosphate-response element binding protein; ERK1/2, extracellular regulated kinase; p-ERK1/2, phospho (Thr202/Tyr204)-p44/42 extracellular regulated kinase.

