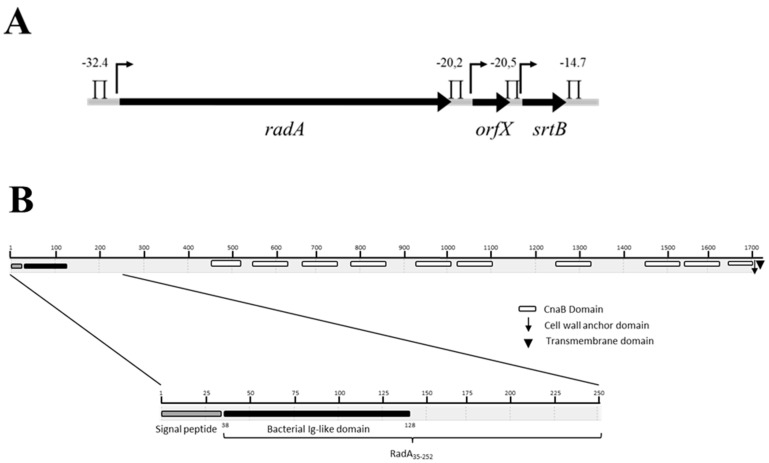
Figure 1.
Schematic representation of the radA cluster (A) and of the RadA domains (B). In Figure 1A, radA, orfX and srtB coding sequences are represented as black arrows and intergenic regions as grey lines. radA, orfX and srtB length (5310 bp, 630 bp and 669 bp, respectively) is not scaled. stands for putative promotors. ∏ indicates putative Rho-independent transcription terminators and the corresponding theoretical ΔG0 expressed as kCal/mol. In Figure 1B, □ represents the CnaB domains, ↓ the LPQTP cell wall anchor domain, and ▼ the C-terminal transmembrane domain.

