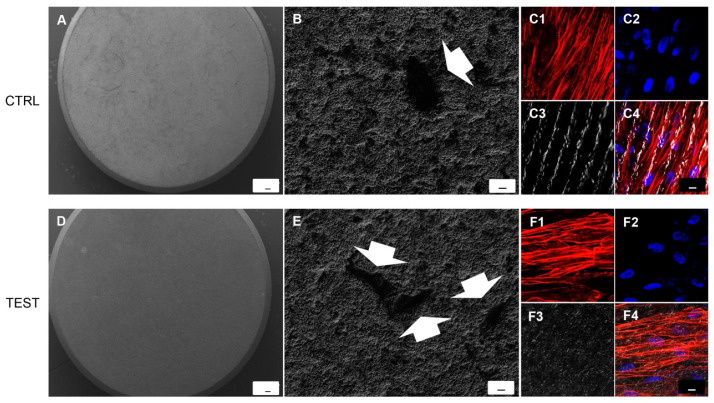
Figure 2.
SEM analysis showed the hPDLSCs adhesion capacity to the titanium implant surfaces. (A) CTRL surface without cells. (B) hPDLSCs adhered on CTRL surface. (D) TEST surface without cells. (E) hPDLSCs adhered on TEST surface. Arrows indicate the cellular profile. Mag: (A,D) 50×; (B,E) 1000×. Scale bars: (A,D) 100 µm; (B,E) 10 µm. (C1–C4) Immunofluorescence images of hPDLSCs cultured on CTRL titanium implant surface. (F1–F4) Immunofluorescence images of hPDLSCs cultured on TEST titanium implant surface. Mag: 40×. Scale bar: 10 µm.

