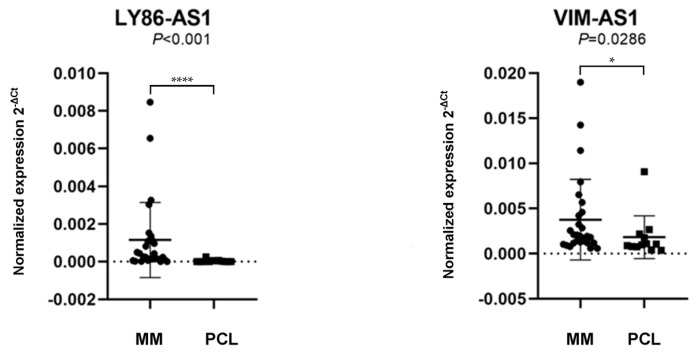
Figure 2.
Comparison of the expression levels of lncRNA lymphocyte antigen antisense RNA 1 (LY86-AS1) and VIM antisense RNA 1 (VIM-AS1) in patients with multiple myeloma (MM) and plasma cell leukemia (PCL). The lncRNAs levels in a validation cohort of patient samples, with the data presentation as the median value of the normalized lncRNA expression and interquartile range (25,75) with the standard deviation. The values were compared using the Mann–Whitney U-test. The expression levels were defined as the 2−ΔCt values normalized to the PPIA expression levels.* p < 0.05, **** p < 0.0001.

