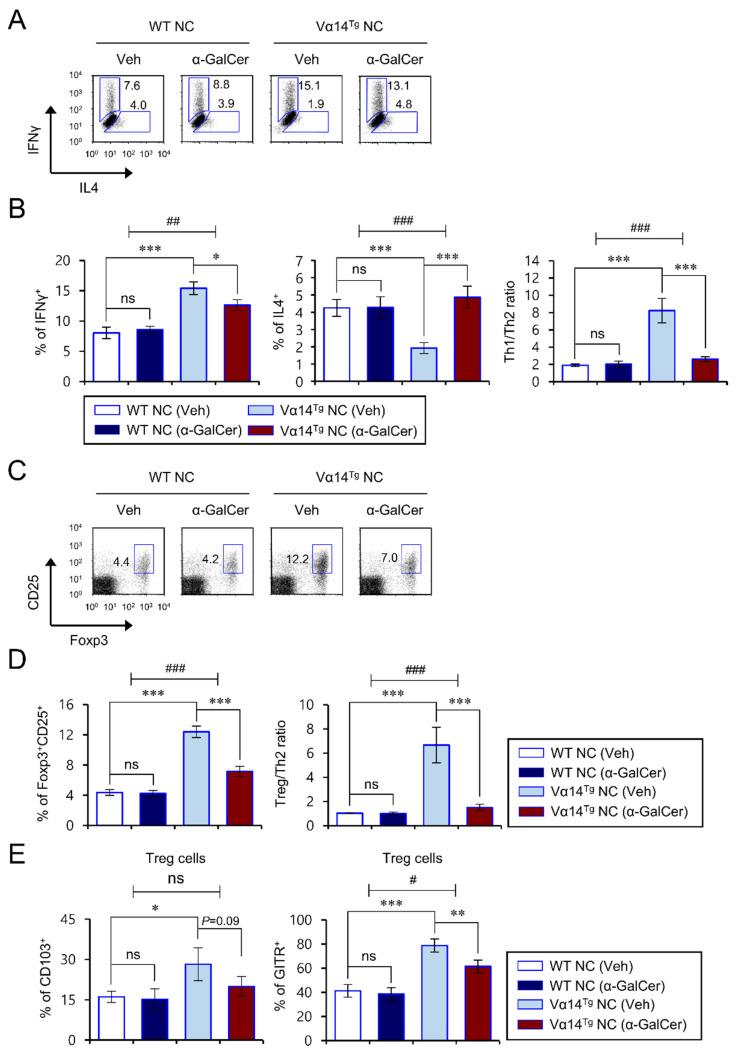
Figure 3.
α-GalCer-mediated exacerbation of AD pathogenesis correlates with reduced Th1/Th2 cytokine ratios and Treg cells in Vα14Tg NC mice. (A–E) Spleens were prepared from mice as shown in Figure 1. (A,B) IFNγ- and IL4-producing populations in splenic CD4+ T cells were determined by flow cytometry. (C,D) The percentage of Foxp3+CD25+ cells among CD4+ T cells was evaluated by flow cytometry. (A,C) Representative FACS plots. (B,D) Summary of data. (E) Cell surface expression of CD103 and GITR on splenic Foxp3+CD25+ Treg cells was analyzed by flow cytometry. The mean values ± SD (n = 4 in (A–E); per group in the experiment; Student’s t-test; * p < 0.05, ** p < 0.01, *** p < 0.001) are shown. Two-way ANOVA (Vα14 TCR Tg × α-GalCer) showed an interaction between these two factors. One representative experiment of two experiments is shown (# p < 0.05, ## p < 0.01 and ### p < 0.001).

