Figure 2.
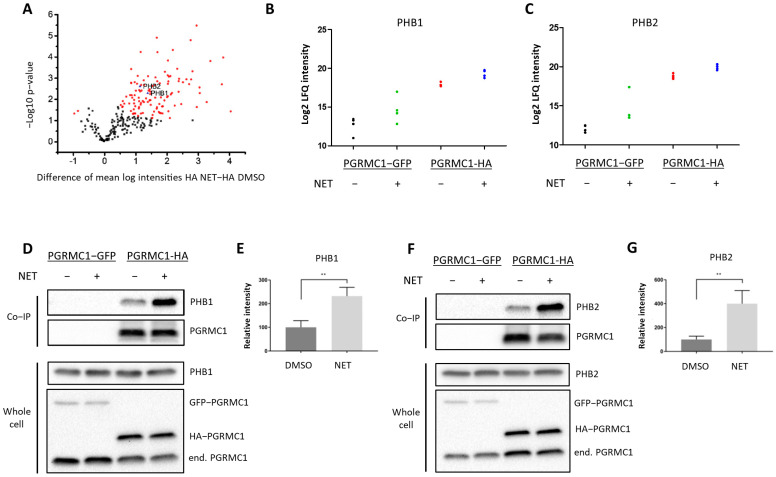
PGRMC1 interacts with the ERα-modulators PHB1 and PHB2 upon treatment with NET. Analysis of immunopurified (HAbased) samples of MCF7/PGRMC1-GFP cells (PGRMC1-GFP) and MCF7/PGRMC1 cells (PGRMC1-HA) treated with DMSO or NET (10−6 M) for co-precipitated proteins. (A) Volcano plot showing the result of a Welch’s t-test including 253 proteins with an increased abundance as revealed by a two-way ANOVA after HA-based enrichment. Proteins represented by red dots and blue triangles show a significantly altered abundance (FDR 0.01%). Mass spectrometry results for co-precipitated (B) PHB1 or (C) PHB2, log2 normalized intensity +: significantly different (Welch’s test). (D,F) Western blot analysis for co-precipitated (D) PHB1 or (F) PHB2 (upper panel) and the protein level of PHB1, PHB2 and PGRMC1 in whole cell lysates from the same cells (lower panel). (E,G) Densitometric analysis for precipitated (E) PHB1 or (G) PHB2. Signal intensity was normalized to PGRMC1-HA/DMSO. Difference between DMSO- and NET-treated samples was calculated with unpaired Student’s t-test. **: p < 0.01.

