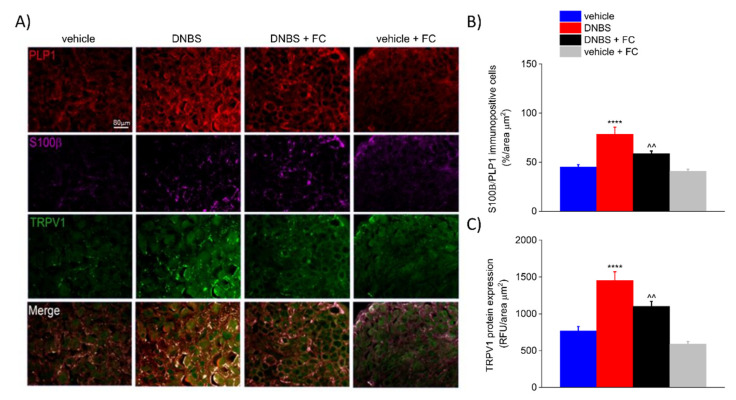
Figure 6.
Effect of systemic fluorocitrate on S100β and TRPV1 increased expression in the DRG of DNBS rats at day 7. (A) Representative images show the expression of PLP1 (red), S100β (purple), and TRPV1 (green) in the DRG and (B,C) relative immunolabeling quantification at day 7 after colitis induction. Data were analysed by one-way ANOVA and Bonferroni post-hoc. Results are expressed as a mean ± SEM of the percentage of PLP1 immunopositive cells that express S100β per area unit (μm2) of n assessments. Results about TRPV1 expression are expressed as average relative fluorescence units (RFUs) ± SEM per area unit of (μm2) of n assessments. **** p < 0.0001 vs. vehicle and ^^ p < 0.01 vs. DNBS. Original magnification: 10×. Scale bar: 80 μm.

