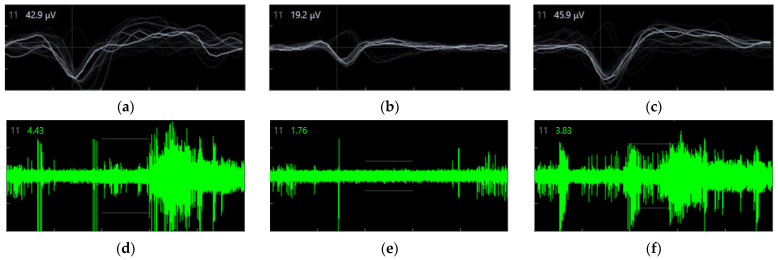
Figure 6.
Spike amplitude recorded by the same electrode in three crucial different timepoints: in all three panels, the typical waveform of the EAP is evident. EAP waveform consists of three main distinct phases: (i) a brief, positive deflection; (ii) a larger negative peak; and (iii) a positive peak of longer duration. The first positive peak of the waveform is due to the positive capacitive current; the second, larger negative peak is the result of Na+ influx eliciting the internal action potential; and the last, longer positive peak mainly corresponds to the K+ efflux responsible for the cell repolarization. (a) baseline (b) after 15 min of treatment with LEV (c) at 24 h after medium replacement (on left upper angles in a, b, and c panels, light-grey numbers represent the electrode number, while white numbers correspond to the last EAP amplitude). Continuous waveform plot of the same electrode showing spiking activity at baseline (d), 15 min of treatment with 1 mM LEV (e), and at 24 h after medium replacement (f) (on left upper angles in d, e, and f panels, light-grey numbers represent the electrode number, and the green ones correspond the basal noise).

