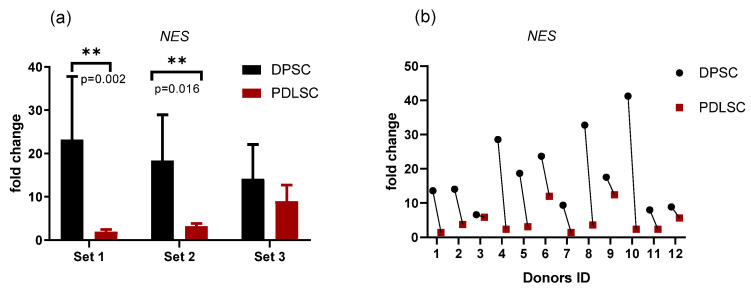
Figure 2.
Nestin gene (NES) transcription in PDLSC and DPSC quantified by qPCR: comparison between samples obtained from the same donor. (a) Average values (mean and standard deviation) obtained in three different experiments (set 1, set 2, set 3; n = 4 in each set); (b) the values for each donor (donors ID are plotted on the X-axis) are shown to demonstrate the variability between donors. Y-axis—fold change. The reference gene—GAPdH. **—p < 0.01 (the exact p-values are also shown).

