Figure 4.
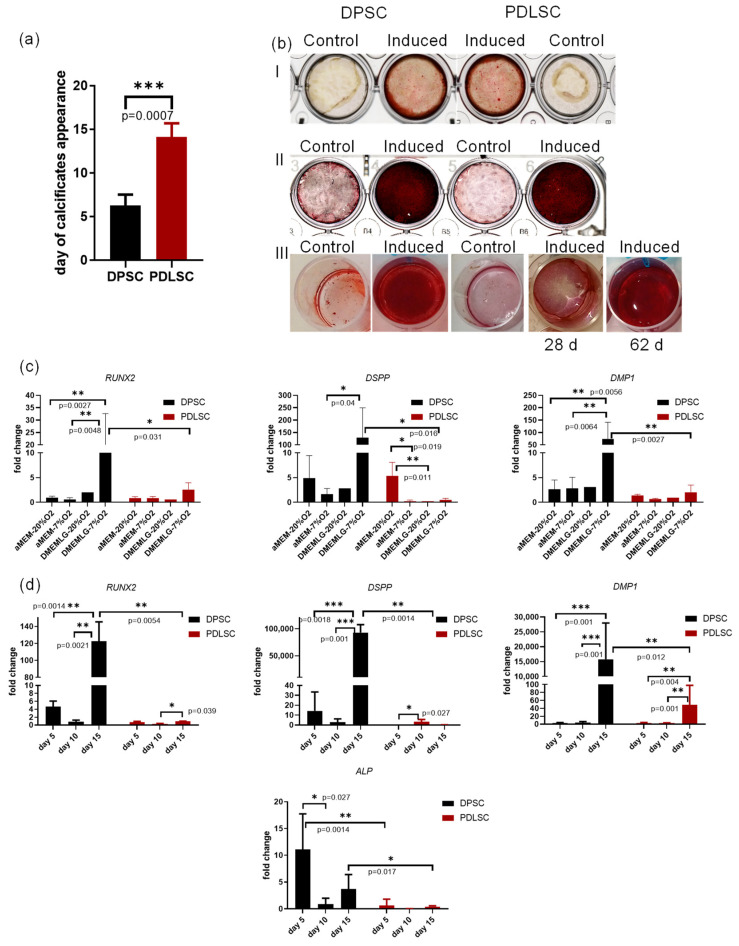
DPSC and PDLSC differentiation after osteogenic induction. (a) the rate of appearance of the first visible calcifications, the day when calcifications were revealed is plotted on the Y-axis; (b) Alizarin staining of DPSC and PDLSC on days 19 (Panel I) and 28 (Panel II) after osteogenic induction. Panel III: a PDLSC sample with delayed differentiation. (c) Transcription of osteogenic and odontogenic markers (RUNX2, Dentin sialophosphoprotein DSPP, Dentin matrix acidic phosphoprotein 1 DMP1) after 72 h post-induction in different cell culture conditions. Cells were grown in different O2 concentration (hypoxia (7% O2) and normoxia, 20% O2) and the osteogenic factors were added either in low glucose DMEM or in α-MEM. (d) Transcription of osteogenic and odontogenic markers (RUNX2, alkaline phosphatase ALP, DSPP, DMP1) during 15 days of differentiation in hypoxia. Y-axis—fold change. Reference gene—GAPdH. *—p < 0.05, **—p < 0.01, ***—p < 0.001; the exact p-values are also shown.

