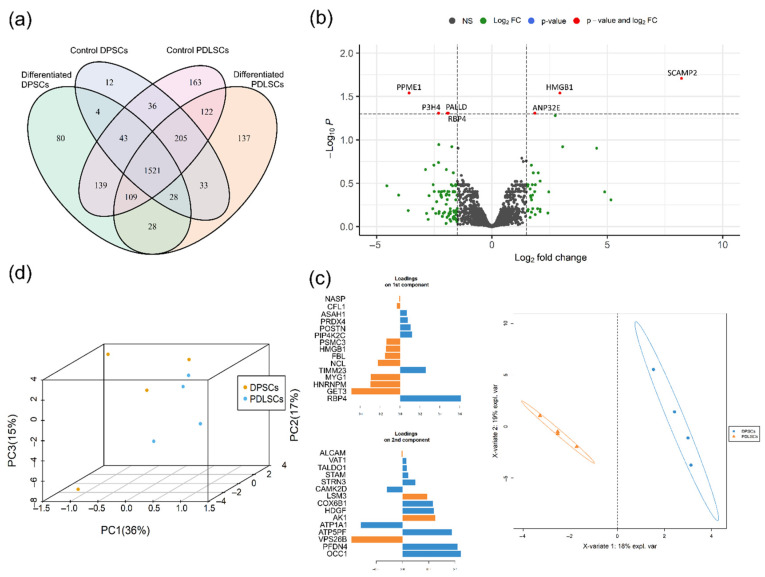
Figure 5.
Comparison of proteomics profiles of PDLSC and DPSC during osteogenic differentiation. (a) Venn diagram representing proteins unique for biological groups compared by shotgun proteomics. (b) Volcano plot representing differentially expressed proteins between DPSC and PDLC. Log2Fold Change—level of change in expression-Log10P—logarithm of p–value. Dotted lines cut off transcripts with p-value < 0.05 and Log2Fold Change > |1.5|. (c) Ordination of DPSC and PDLSC by principal component analysis. Blue dots—DPSC, orange dots—PDLSC. (d) Classification of DPSC and PDLSC by sparse Partial Least Squares Discriminant Analysis (sPLS–DA). Blue circles—DPSC, orange triangles—PDLSC. Loadings on the 1st and 2nd component represent 15 proteins, which contribute the most to the respective components, the color represent in which of the group the mean of the protein is maximal.

