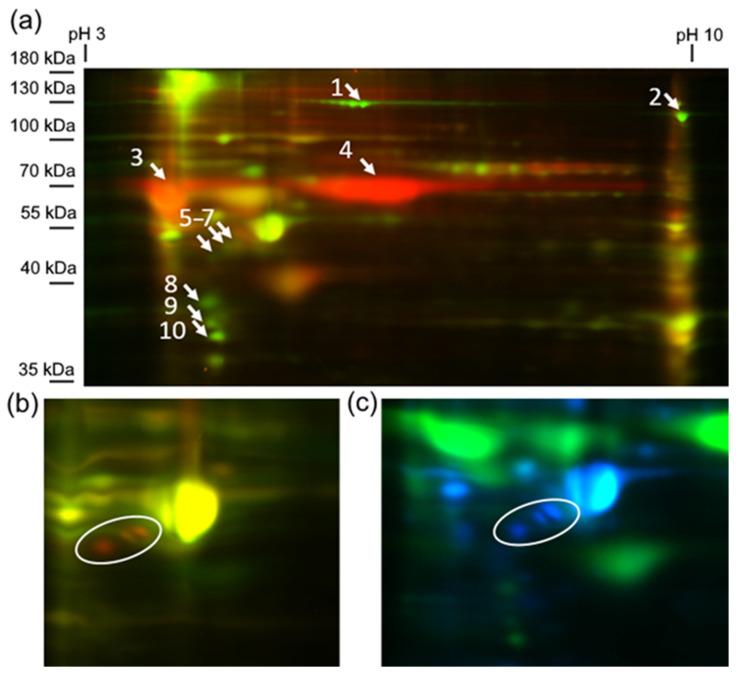
Figure 6.
Differentially expressed proteins identified by 2D–DIGE. (a) Electropherogram corresponding to the overlapping of Cy fluorochrome channels of control (green) and differentiated (red) DPSC. Numbers marked differentially expressed protein spots reproducibly presented in both biological replicates of some of the biological groups. (b) Electropherogram corresponding to the overlapping of Cy fluorochrome channels of control (green) and differentiated (red) PDLSC. White circle—protein spots 5–7, specific for differentiated PDLSC. (c) Electropherogram corresponding to the overlapping of Cy fluorochrome channels of differentiated DPSC (green) and differentiated (blue) PDLSC. White circle—protein spots 5–7, specific for differentiated PDLSC.

