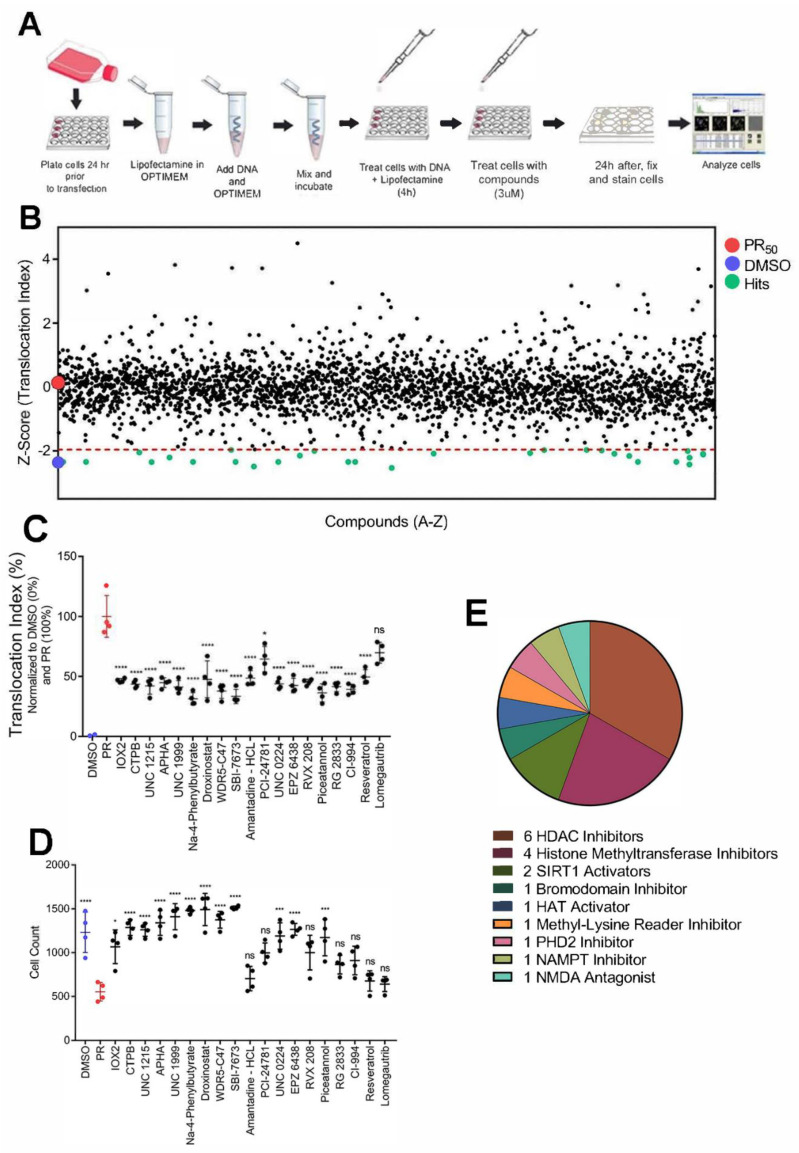
Figure 5.
A phenotypic screen for modifiers of disrupted nucleocytoplasmic transport in U-2 OS cells expressing PR50. (A) Schematic of the phenotypic screen workflow. U-2 OS cells stably expressing NCT-C biosensor were plated 24 h prior to PR50 transfection and treated with compounds at 3 µM 4 h thereafter. After 24 h of compound exposure, plates were fixed with 4% paraformaldehyde, stained with DAPI and an anti-PR antibody prior to image acquisition. (B) Scatterplot of compound Z-factors across all compound libraries at a single concentration (3 µM) in the presence of PR50. A more negative Z-factor indicates restored NCT-C; whereas, a more positive Z-factor indicates disrupted NCT-C. (C) A confirmatory screen of the translocation index of top compounds from the primary screen mentioned above. Cells were either treated with vehicle (DMSO), untreated and expressing PR50 (PR), or treated with compound at 3 µM for 24 h in the presence of PR50. Each condition was repeated 4 times. (D) A scatterplot of cell counts under each condition from the confirmatory screen mentioned above. (E) A pie chart indicating the class of each hit compound tested in the confirmatory screen. * p < 0.05; *** p < 0.001; **** p < 0.0001; ns = non-significant.

