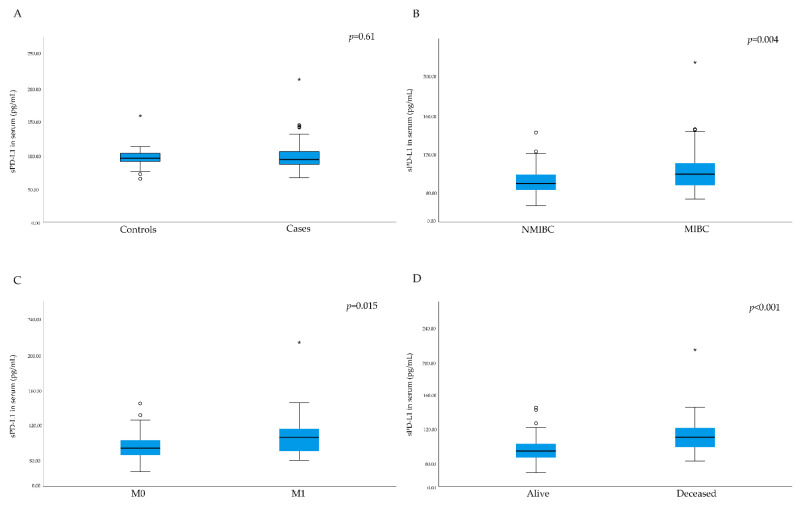
Figure 1.
Box plots of serum levels of soluble programmed death ligand 1 (sPD-L1). (A) Across controls and cases. (B) Patients with non-muscular invasive disease (NMIBC) versus patients with muscular invasive disease (MIBC). (C) Patients with (M1) or without distant metastases (M0). (D) Patients who died during follow-up vs. patients who survived during the follow-up time. Outliers in the data are represented by a circle (°), and extreme outliers are represented by an asterisk (*).

